Service Design
UX/UI Design
PC Dashboard
2022
Client. Etri
( Electronics and Telecommunications
Research Institute
in Korea)
Service Design
UX/UI Design
PC Dashboard
2022
Client. Etri
( Electronics and Telecommunications
Research Institute
in Korea)
Service Design
UX/UI Design
PC Dashboard
2022
Client. Etri
( Electronics and Telecommunications
Research Institute
in Korea)

Service Design
UX/UI Design
PC Dashboard
2022
Client. Etri
( Electronics and Telecommunications
Research Institute
in Korea)
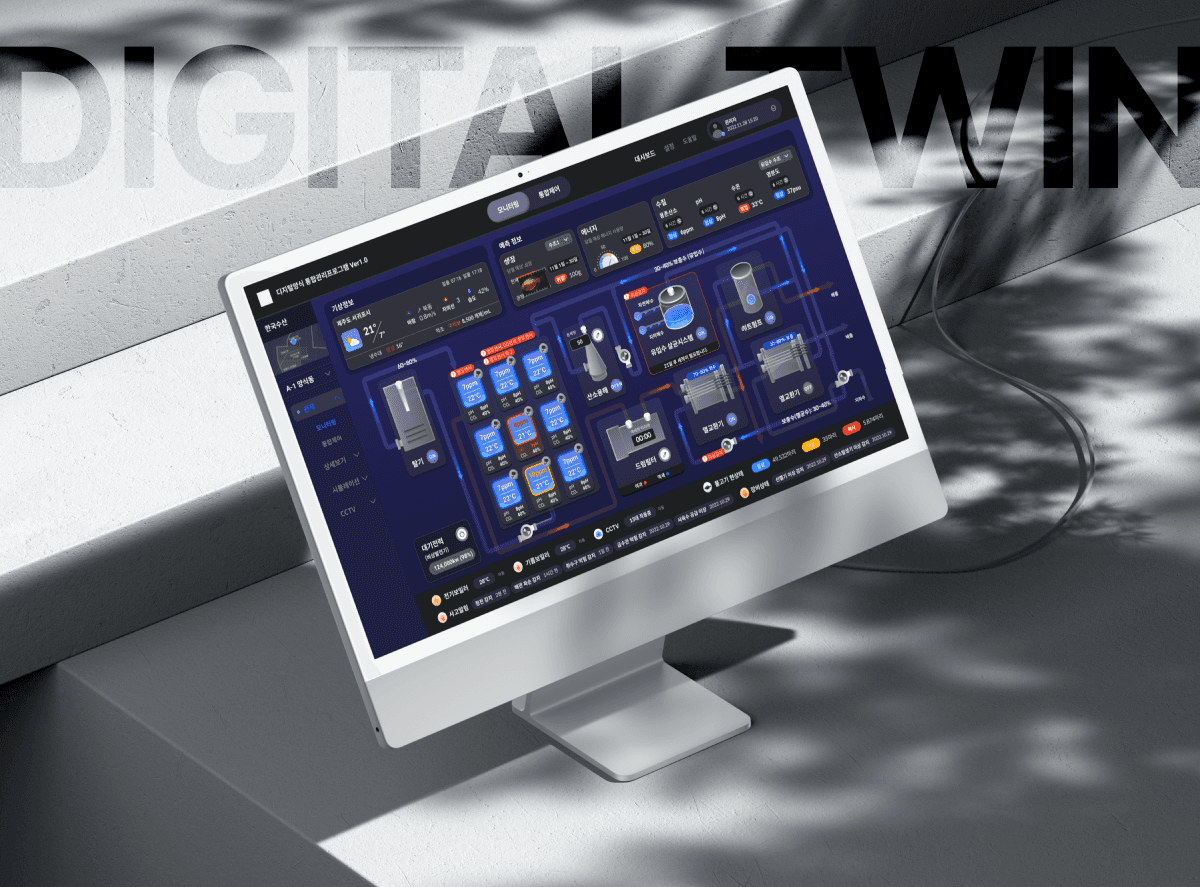
Digital Twin Technology-Based
Smart Aquaculture Farm Dashboard

Seamless Precision:
Monitoring, Integrating Control,
and Simulating in Aquaculture
Seamless Precision:
Monitoring, Integrating Control, and Simulating in Aquaculture
Seamless Precision:
Monitoring, Integrating Control,
and Simulating in Aquaculture
Seamless Precision:
Monitoring, Integrating Control,
and Simulating in Aquaculture
“ A smart aquaculture dashboard precisely designed based on digital twin technology provides a differentiated experience of the smart new aquaculture industry. “
“ A smart aquaculture dashboard precisely designed based on digital twin technology provides a differentiated experience of the smart new aquaculture industry. “
This dashboard provides an intuitive and comprehensive interface to monitor, integrate control, and simulate aquaculture operations seamlessly. Designed to operate effortlessly within a single screen, this program innovatively enhances efficiency and precision across all aspects of fish farming without the need for multiple steps.
This dashboard provides an intuitive and comprehensive interface to monitor, integrate control, and simulate aquaculture operations seamlessly. Designed to operate effortlessly within a single screen, this program innovatively enhances efficiency and precision across all aspects of fish farming without the need for multiple steps.
This dashboard provides an intuitive and comprehensive interface to monitor, integrate control, and simulate aquaculture operations seamlessly. Designed to operate effortlessly within a single screen, this program innovatively enhances efficiency and precision across all aspects of fish farming without the need for multiple steps.

What is Smart Aquaculture?
What is
Smart Aquaculture?
What is Smart Aquaculture?
What is Smart Aquaculture?
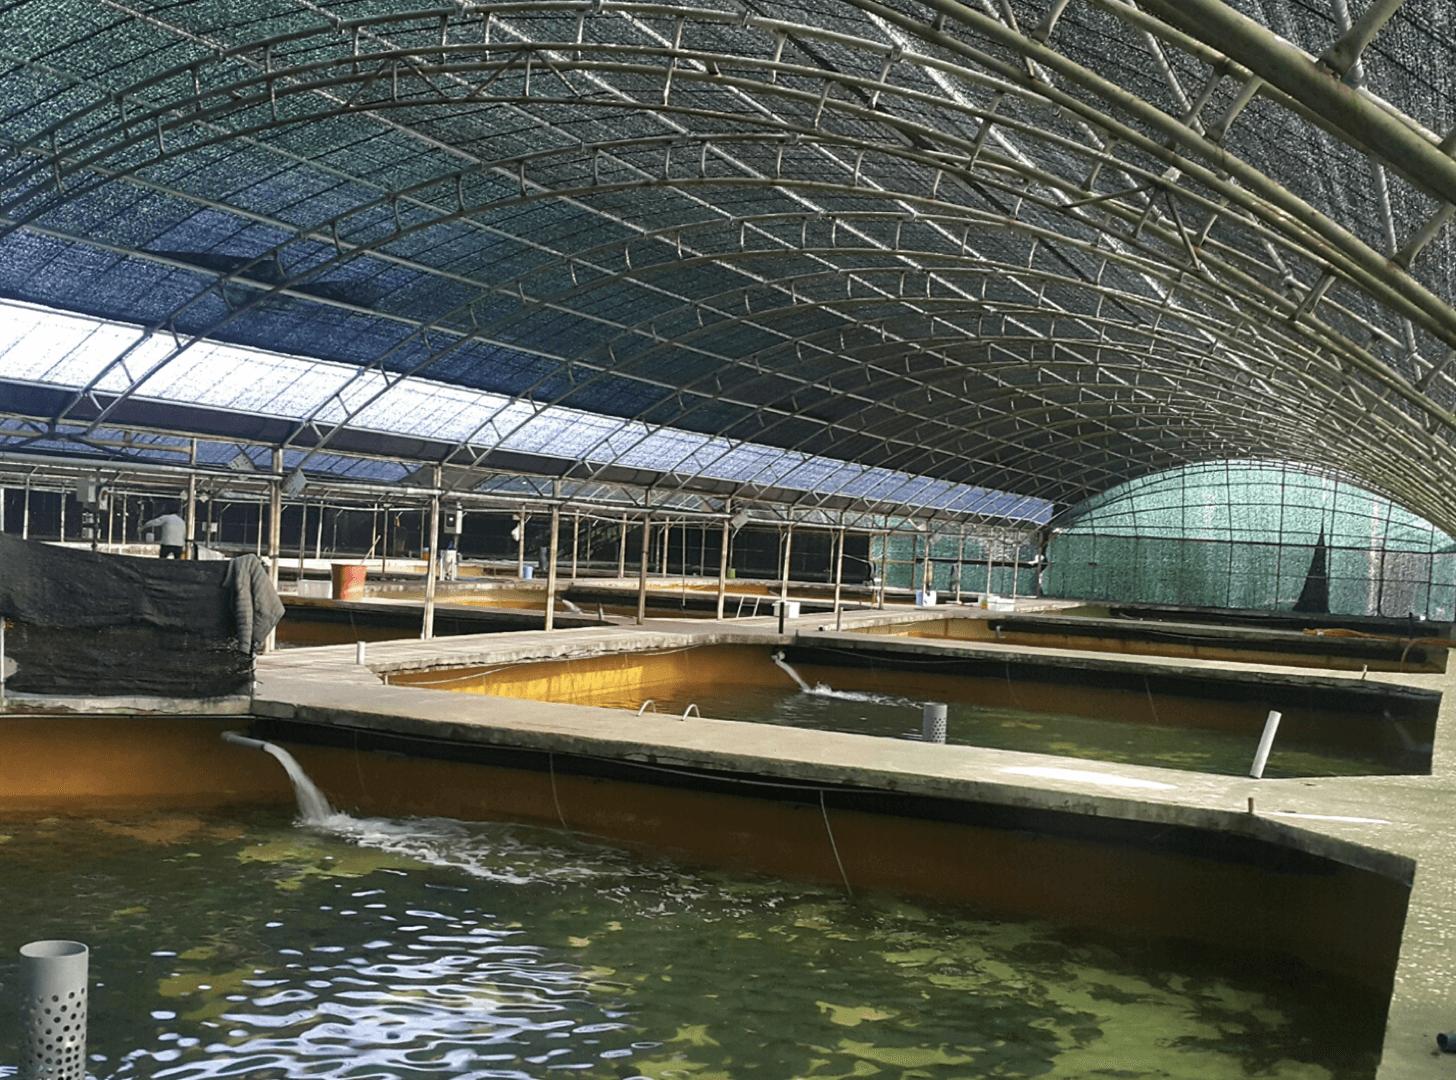
Smart aquaculture refers to the construction of optimal growth algorithms for cultured aquatic products, aimed at efficient and environmentally friendly production. This involves automating and intelligentizing the entire production-processing-sales industry system of cultured aquatic products using technologies such as big data, artificial intelligence (AI), and the Internet of Things (IoT).
Data collected from aquaculture facilities is utilized for the analysis and prediction of the aquaculture environment, enabling not only stable production of fish but also planned production tailored to market demand.
Smart Aquaculture
Facility 2
(Data Accumulation/Analysis
/Processing/Utilization)
Smart Aquaculture
Facility 3
Smart Aquaculture
Facility N
Collection of farm environment, genome/positive, feed
and disease, operational and digital trial data
Utilize monitoring equipment
(data hub)
Data Processing and Automation
(Intelligent Digital Twin)
Smart Form Big Data Center
Standardize data
and information,
platforms and S/W
Provides data opening services
such as analysis S/W and platform
optimal growth environment modeling
(Smart aquaculture facilities fishing
houses/research institutes/small
and medium-sized enterprises)
Smart Aquaculture
Facility 1

Problem&Goal
Problem&Goal
Problem&Goal
Barriers and Solutions
for the Transformation of the Digital Environment of Aquaculture Workers
Barriers and Solutions
for the Transformation of the Digital Environment of Aquaculture Workers
Barriers and Solutions
for the Transformation of the Digital Environment of Aquaculture Workers
Barriers and Solutions
for the Transformation of the Digital Environment of Aquaculture Workers
As the smart aquaculture industry experiences rapid growth, traditional aquaculture practitioners are gradually transitioning their business operations into the digital realm. However, many domestic aquaculture professionals are facing difficulties in adapting and learning in the digital environment. In response to the demands of the Fourth Industrial Revolution, the Electronics and Telecommunications Research Institute (ETRI) has devised a new program aimed at lowering the initial barriers to entry for the smart aquaculture industry, facilitating a smoother transition for practitioners
As the smart aquaculture industry experiences rapid growth, traditional aquaculture practitioners are gradually transitioning their business operations into the digital realm. However, many domestic aquaculture professionals are facing difficulties in adapting and learning in the digital environment. In response to the demands of the Fourth Industrial Revolution, the Electronics and Telecommunications Research Institute (ETRI) has devised a new program aimed at lowering the initial barriers to entry for the smart aquaculture industry, facilitating a smoother transition for practitioners
As the smart aquaculture industry experiences rapid growth, traditional aquaculture practitioners are gradually transitioning their business operations into the digital realm. However, many domestic aquaculture professionals are facing difficulties in adapting and learning in the digital environment. In response to the demands of the Fourth Industrial Revolution, the Electronics and Telecommunications Research Institute (ETRI) has devised a new program aimed at lowering the initial barriers to entry for the smart aquaculture industry, facilitating a smoother transition for practitioners.
Problem
Problem
It is difficult for actual aquaculture workers,
not technical researchers, to learn smart aquaculture programs.
It is difficult for actual aquaculture workers, not technical researchers, to learn smart aquaculture programs.
" Looking at the data feels like it's only technical experts. I hope it's easy to find out and control it."
(ㅇㅇ Aquaculture Farm, Mr. Kim)
(ㅇㅇ Aquaculture Farm, Mr. Kim)
User Interview 01
User Interview 02
" "It's so hard to see where you can control it at a glance, even when you look at a notification alert."
" It's so hard to see where you can control it at a glance, even when you look at a notification alert."
(ㅁㅁ Aquaculture Farm, Mr. Lee)
(ㅁㅁ Aquaculture Farm, Mr. Lee)
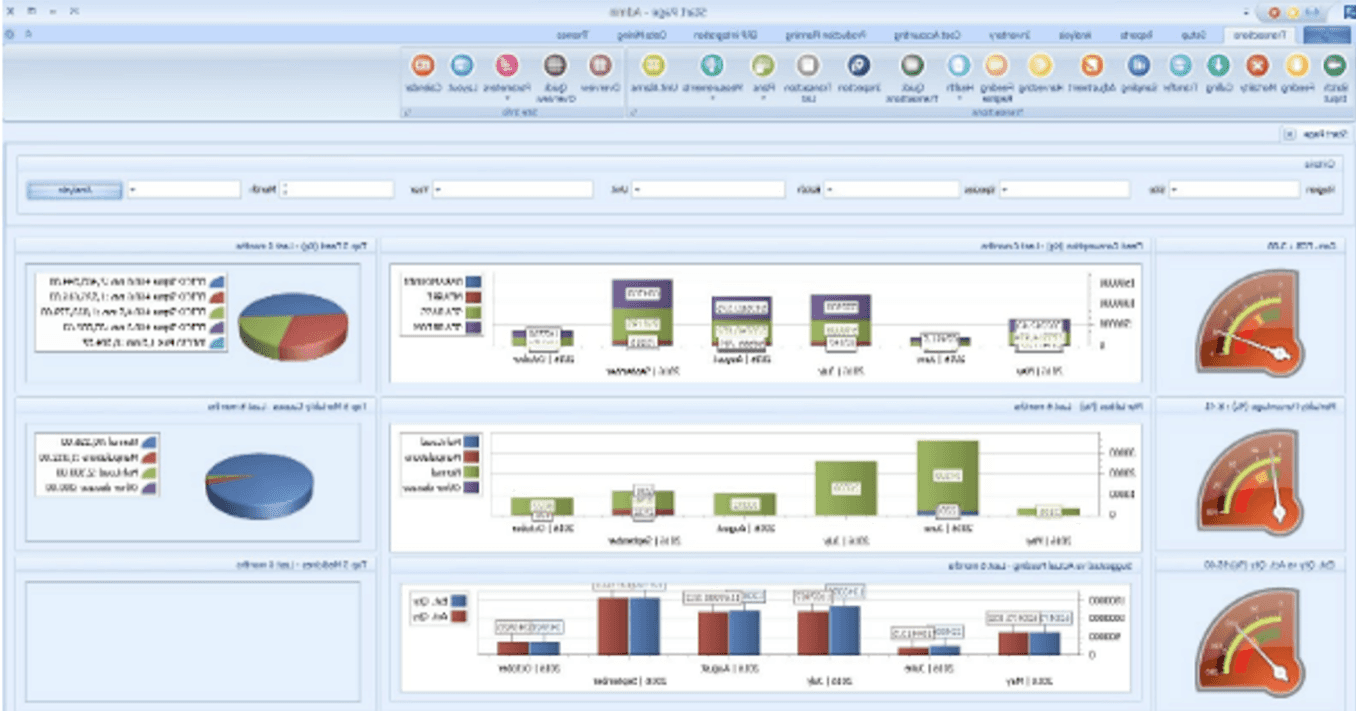
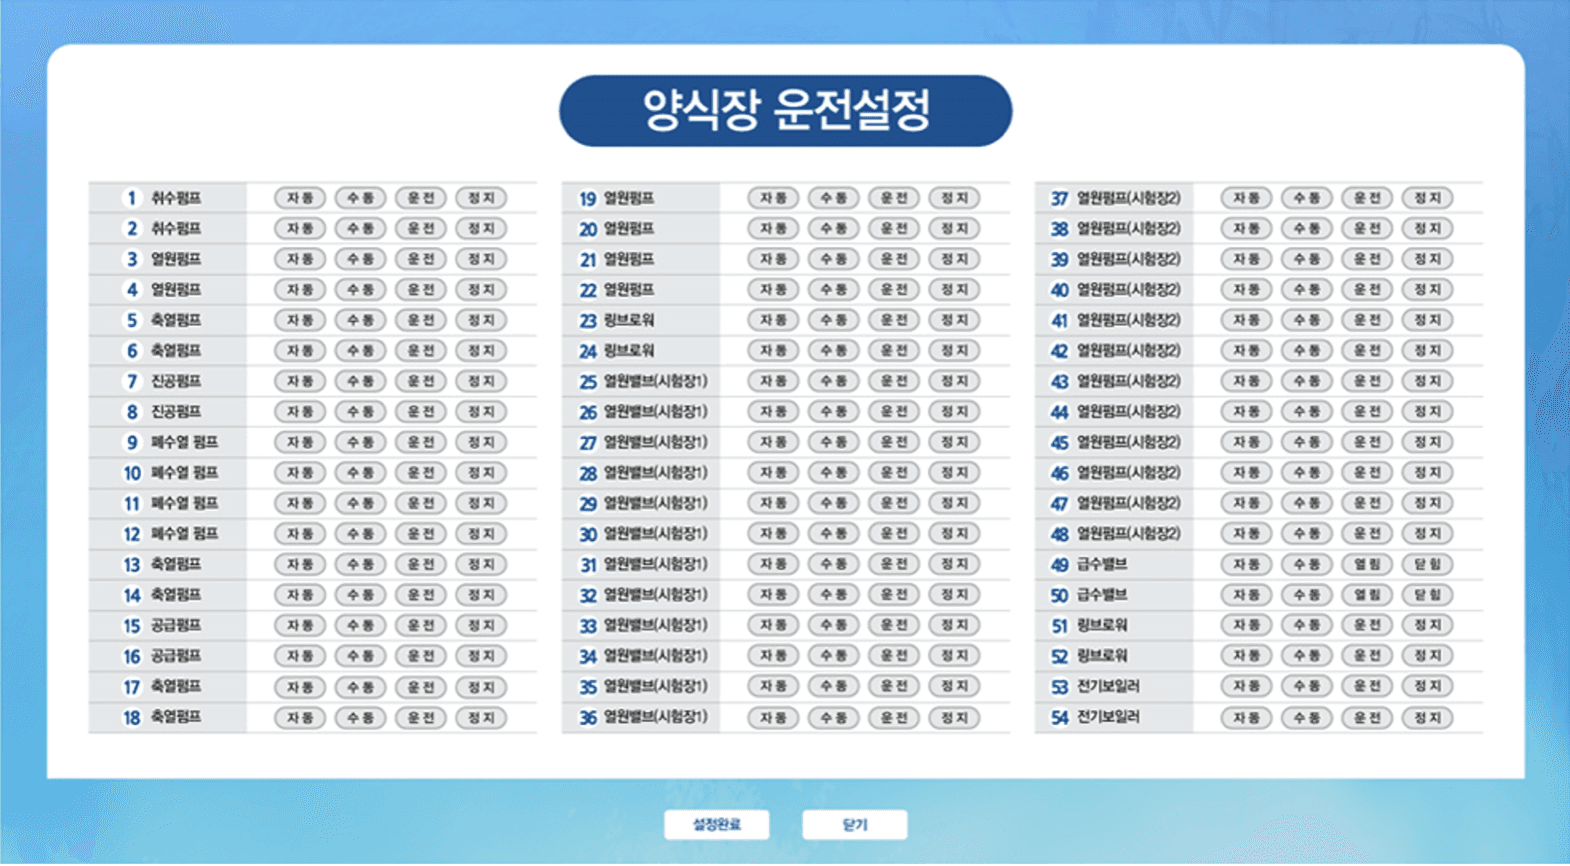
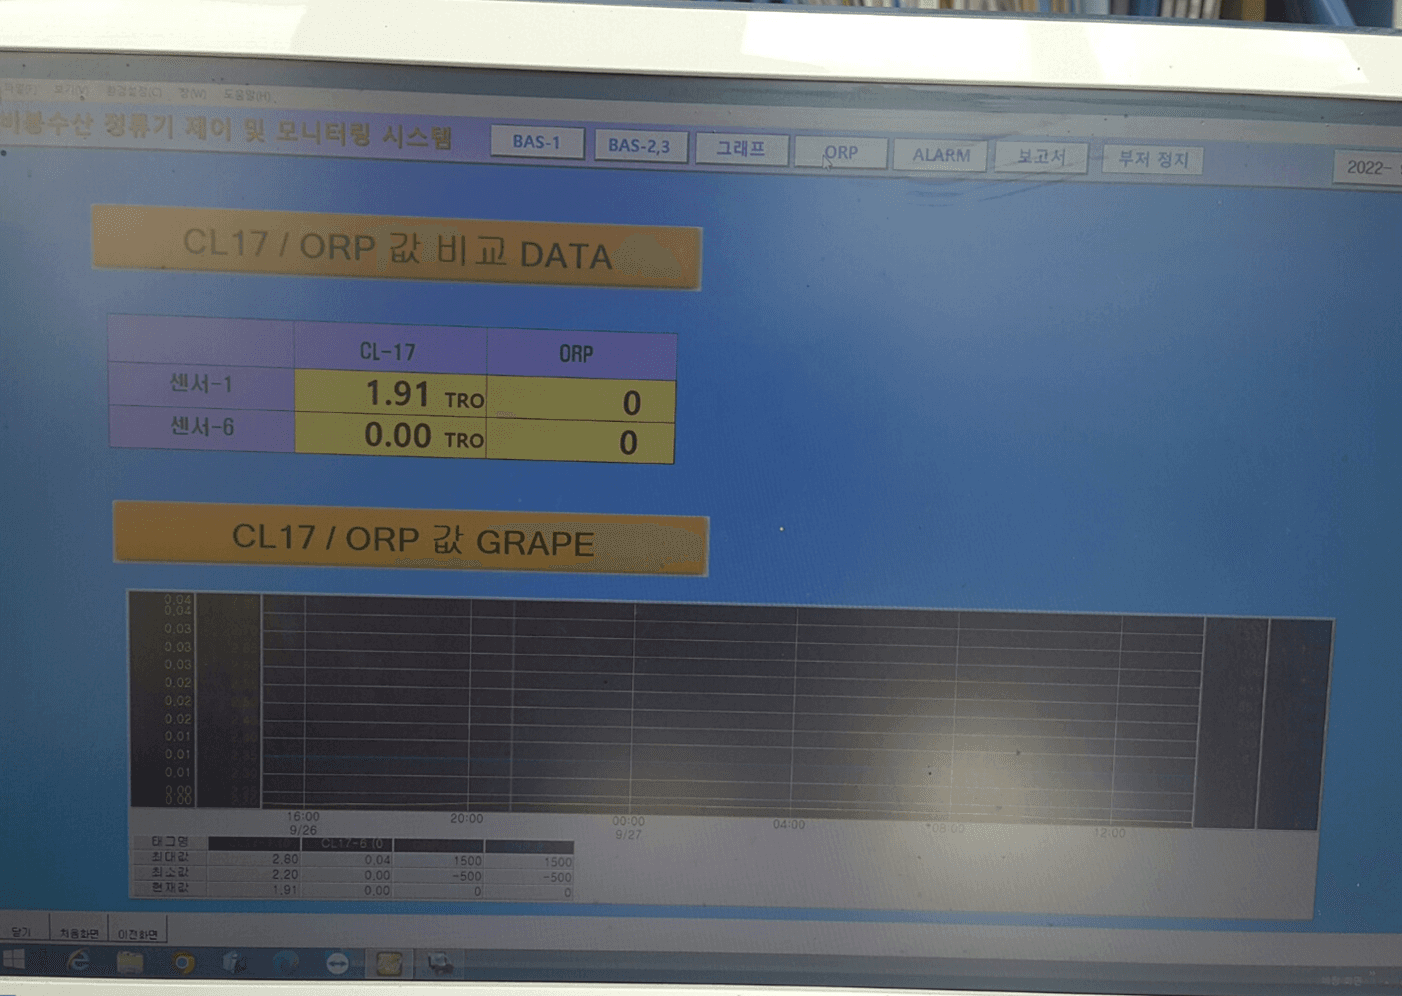
Current Smart Aquaculture Farm Dashboard
Current Smart Aquaculture
Farm Dashboard
Current Smart Aquaculture Farm Dashboard

Solution
Solution
Building an intuitive digital environment that is fast to learn and adapt
Building an intuitive digital environment that is fast to learn and adapt
Building an intuitive digital environment
that is fast to learn and adapt
Building an intuitive digital environment that is fast to learn and adapt
Creating an intuitive digital environment to facilitate quick learning and adaptation even for users not familiar with digital technology.
Creating an intuitive digital environment to facilitate quick learning and adaptation even for users not familiar with digital technology.

Research 01
Research 01
User Journey Map
User Journey Map
User Journey Map
Based on actual interviews with users currently operating smart aquaculture facilities, we constructed their journey maps and closely examined the pain points and touchpoints they experience in practice.
Journey
Behavior
Pain Points
Touch Points
01
The Beginning Stage
Enter basic information for the form and initial settings
Complex initial setup, processes, and technical difficulties
Provides user-friendly guides and tutorials
02
Daily Monitoring
Farm Sensors
and Data Monitoring
Information overload, and difficulty finding the information you need
Intuitive dashboard
and custom notifications settings
03
Remote Control
Remotely control the farm and manipulate the sensor
High entry barriers, complex manipulation processes
Easy remote control and user convenience enhancements
04
Responding to the problem
Alerting and Issue Resolution
Difficulty solving problems quickly, unclear warning messages
Detailed, easy-to-understand alert notifications, quick support
05
Performance Evaluation
Productivity and
Efficiency Analysis
Difficulty interpreting data, difficulty identifying performance
Provides intuitive reporting and user-oriented performance assessment tools
Research 02
Research 02
In-Depth Interview
In-Depth Interview
In-Depth Interview
Based on actual interviews with users currently operating smart aquaculture facilities, we constructed their journey maps and closely examined the pain points and touchpoints they experience in practice.
Based on actual interviews with users currently operating smart aquaculture facilities, we constructed their journey maps and closely examined the pain points and touchpoints they experience in practice.
Is it smooth to look at the simulation data and control the actual farm?
I'm used to seeing simulation data, but it's still too difficult to operate in accordance with the simulation results.
Is the current simulation only showing the results and is the operation manual for the results?
Some parts are automatically controlled, but it is very difficult to respond immediately when manual control is needed in the middle. Most of the controls are made up of text, so it is difficult to know which button to press to control immediately.
User Interview
#Text based interfaces
#Text based interfaces
#Immediate response to difficulty
#Immediate response to difficulty

Research 01
User Journey Map
Based on actual interviews with users currently operating smart aquaculture facilities, we constructed their journey maps and closely examined the pain points and touchpoints they experience in practice.
Journey
Behavior
Pain Points
Touch Points
01
The Beginning Stage
Enter basic information for the form and initial settings
Complex initial setup, processes, and technical difficulties
Provides user-friendly guides and tutorials
02
Daily Monitoring
Farm Sensors
and Data Monitoring
Information overload, and difficulty finding the information you need
Intuitive dashboard
and custom notifications settings
03
Remote Control
Remotely control the farm and manipulate the sensor
High entry barriers, complex manipulation processes
Easy remote control and user convenience enhancements
04
Responding to the problem
Alerting and Issue Resolution
Difficulty solving problems quickly, unclear warning messages
Detailed, easy-to-understand alert notifications, quick support
05
Performance Evaluation
Productivity and
Efficiency Analysis
Difficulty interpreting data, difficulty identifying performance
Provides intuitive reporting and user-oriented performance assessment tools
Research 02
In-Depth Interview
Based on actual interviews with users currently operating smart aquaculture facilities, we constructed their journey maps and closely examined the pain points and touchpoints they experience in practice.
Is it smooth to look at the simulation data and control the actual farm?
I'm used to seeing simulation data, but it's still too difficult to operate in accordance with the simulation results.
Is the current simulation only showing the results and is the operation manual for the results?
Some parts are automatically controlled, but it is very difficult to respond immediately when manual control is needed in the middle. Most of the controls are made up of text, so it is difficult to know which button to press to control immediately.
User Interview
#Text based interfaces
#Immediate response to difficulty
Insight
Insight
Complicated
Complicated
Complicated
Complicated
#Complex data interpretation
#Complex data interpretation
#Complex operation process
#Complex operation process
#Identify complex performance
#Identify complex performance
Proposal
Proposal
UX Strategy
UX Strategy
Immediate
Immediate
Immediate
Immediate
Providing an experience where all situations in the aquaculture facility can be instantly monitored, controlled, and operational efficiency can be immediately assessed.
Persona
Persona
The target persona
that will use the program
The target persona
that will use the program
The target persona
that will use the program
Persona
The target persona
that will use the program
We have crafted representative target personas for users who will be using the program. Through precise target identification, we can achieve an optimized program design centered around the user experience.

Taejun Kim
45-year-old president of Twin Aquaculture Farm,
lives in Jeju Island
45-year-old president of Twin Aquaculture
Farm, lives in Jeju Island
Digital Acquisition
Low
High
Digital Adaptability
Low
High
Digital Interest
Low
High
Digital Acquisition
Digital Acquisition
Digital Adaptability
Digital Adaptability
Digital Interest
Digital Interest
Low
Low
High
High
Low
Low
High
High
Low
Low
High
High
#A return village
#A return village
#Interest in new technologies
#Interest in new technologies
#A diligent CEO
#A diligent CEO
Taejun Kim
45-year-old president of Twin Aquaculture
Farm, lives in Jeju Island
Digital Acquisition
Low
High
Digital Adaptability
Low
High
Digital Interest
Low
High
#A return village
#Interest in new technologies
#A diligent CEO
Taejun Kim
45-year-old president of Twin Aquaculture Farm,
lives in Jeju Island
Digital Acquisition
Low
High
Digital Adaptability
Low
High
Digital Interest
Low
High
Digital Acquisition
Digital Adaptability
Digital Interest
Low
High
Low
High
Low
High
#A return village
#Interest in new technologies
#A diligent CEO
Taejun Kim
45-year-old president of Twin Aquaculture
Farm, lives in Jeju Island
Digital Acquisition
Low
High
Digital Adaptability
Low
High
Digital Interest
Low
High
#A return village
#Interest in new technologies
#A diligent CEO
About
Taejun saw the vision of a smart farm using digital twin technology brightly and started a halibut smart farm business after returning home. He is interested in learning new technologies, but he is not familiar with the digital environment, so it takes time to learn the overall digital system of a smart farm. In addition, it has not been long since he started the aquaculture industry, so he has difficulty analyzing professional data.
Taejun saw the vision of a smart farm using digital twin technology brightly and started a halibut smart farm business after returning home. He is interested in learning new technologies, but he is not familiar with the digital environment, so it takes time to learn the overall digital system of a smart farm. In addition,
it has not been long since he started the aquaculture industry, so he has difficulty analyzing professional data.
Goal
He wants to learn the smart farm system with digital twin technology faster and apply it to the business.
He wants to use smart technology to efficiently monitor and control and continue his business according to accurately predicted data.
Pain Point
He has a hard time with a lot of text due to old age.
He takes a long time to learn the digital environment.
He lacks professional farm data analysis.
He finds it difficult to recognize the problem immediately and control it immediately.
Core Functions
Core Functions
A program that uses digital twin technology to intuitively monitor, instantly control, and accurately predict the state of the farm
A program that uses digital twin technology to intuitively monitor, instantly control, and accurately predict the state of the farm
A program that uses digital twin technology to intuitively monitor, instantly control, and accurately predict the state of the farm
A program that uses digital twin technology to intuitively monitor, instantly control, and accurately predict the state of the farm

#Complex data interpretation
#Complex data interpretation
#Complex data
interpretation
Digital Twin
Data mirroring
Digital Twin
Data
mirroring
Function 01
Function 01
Function 01
Intuitive
Intuitive
Intuitive
Monitoring
Monitoring
Monitoring
#Complex operation process
#Complex
operation process
Digital Twin
Data Processing / Automation
Digital Twin
Data Processing
/ Automation
Function 02
Function 02
Function 02
Intuitive
Intuitive
Intuitive
Integrated
control
Integrated
control
Integrated
control
#Identify complex performance
#Identify complex performance
#Identify complex
performance
Digital Twin
data analysis, simulation
Digital Twin
data analysis,
simulation
Function 03
Function 03
Function 03
Accurate Prediction
Accurate Prediction
Accurate
Prediction
Simulation
Simulation
Simulation
Facility Status
actual condition
Digital Twin
Digital Twin Detail Status
Detailed operational status
Operational
forecast
Main
Facility monitoring
Facility Control
View details
growth
growth
All
All
View by water tank
View details
Full screen
Full screen
water quality
water quality
Energy
Energy
Simulation
CCTV
Monitoring / Control
Simulation
Digital Twin Forecast

Engineer
Etri
Real user
Aquaculture
Farm
Design
CTD
Engineer
Etri
Real user
Aquaculture
Farm
Design
CTD
"In order to optimize the detailed features and elements of the complex smart farm program, real-time close and active communication between end users, engineers, and design teams was conducted."
"In order to optimize the detailed features and elements of the complex smart farm program, real-time close and active communication between end users, engineers, and design teams was conducted."


UI Concept
UI Concept
Target: Difficulty
in recognizing text
Realistic
3D Icon / 3D Color
Increase visual recognition
Realistic
Visualization
Realistic
Visualization
Realistic
Visualization
Target: Difficulty
in recognizing text
실제와 같은 이미지화
3D Icon / 입체적 색감
시각인지 높임

Button
Target: Difficulty
in recognizing text
Realistic
3D Icon / 3D Color
Increase
visual recognition

Final Design
Final Design
Smart aquaculture program that manages a farm
instantly on one screen
Smart aquaculture program that manages a farm
instantly on one screen
Smart aquaculture program
that manages a farm
instantly on one screen

Final Design
Smart aquaculture program
that manages a farm
instantly on one screen
Prototype
Prototype
View Figma prototype
View Figma prototype
View Figma prototype
Prototype
View Figma prototype
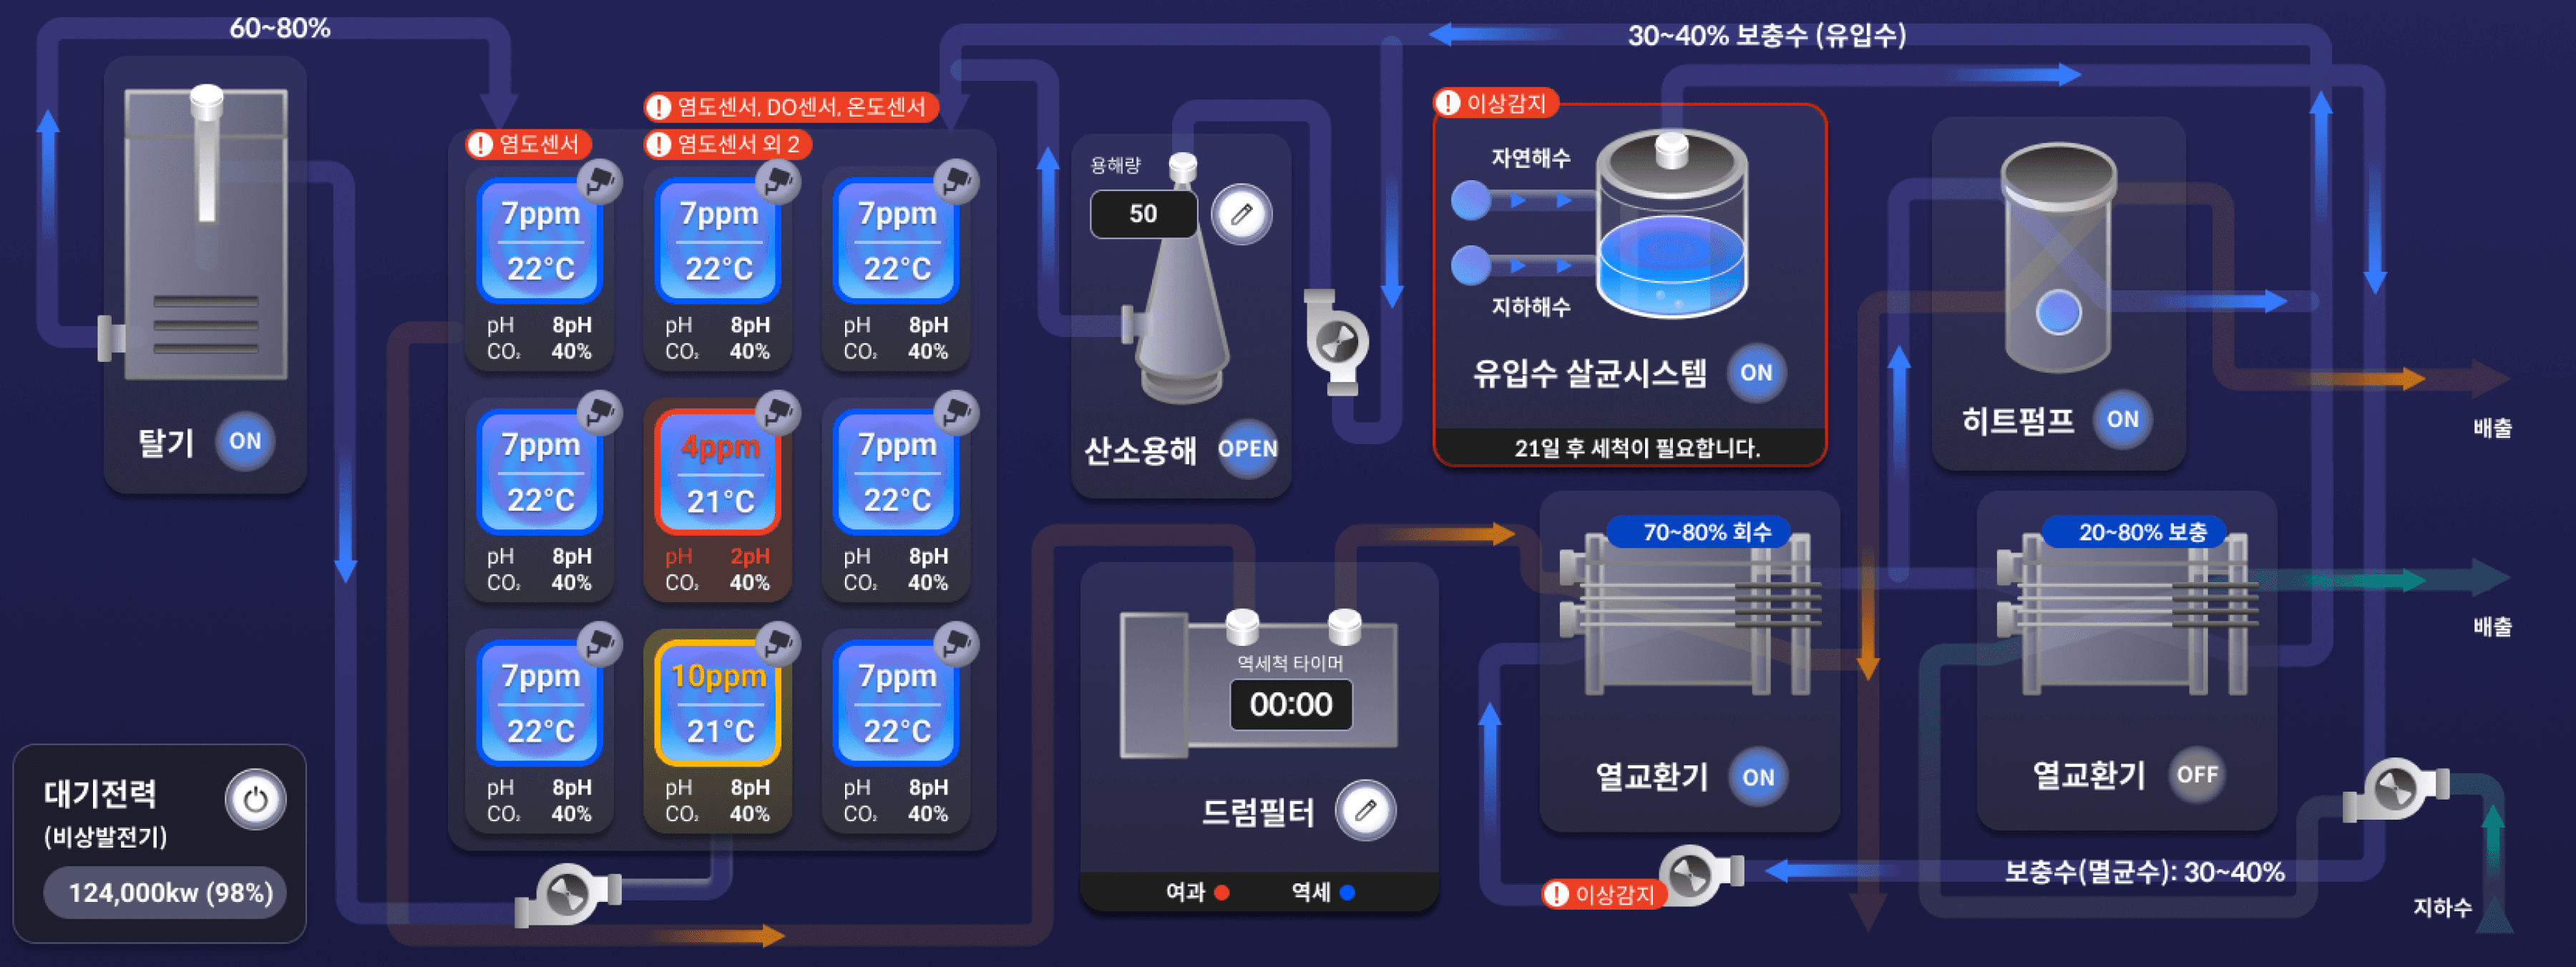
Main - Control the entire facility
Main - Control the entire facility
Monitor and control
the entire facility
on one screen
Monitor and control
the entire facility
on one screen
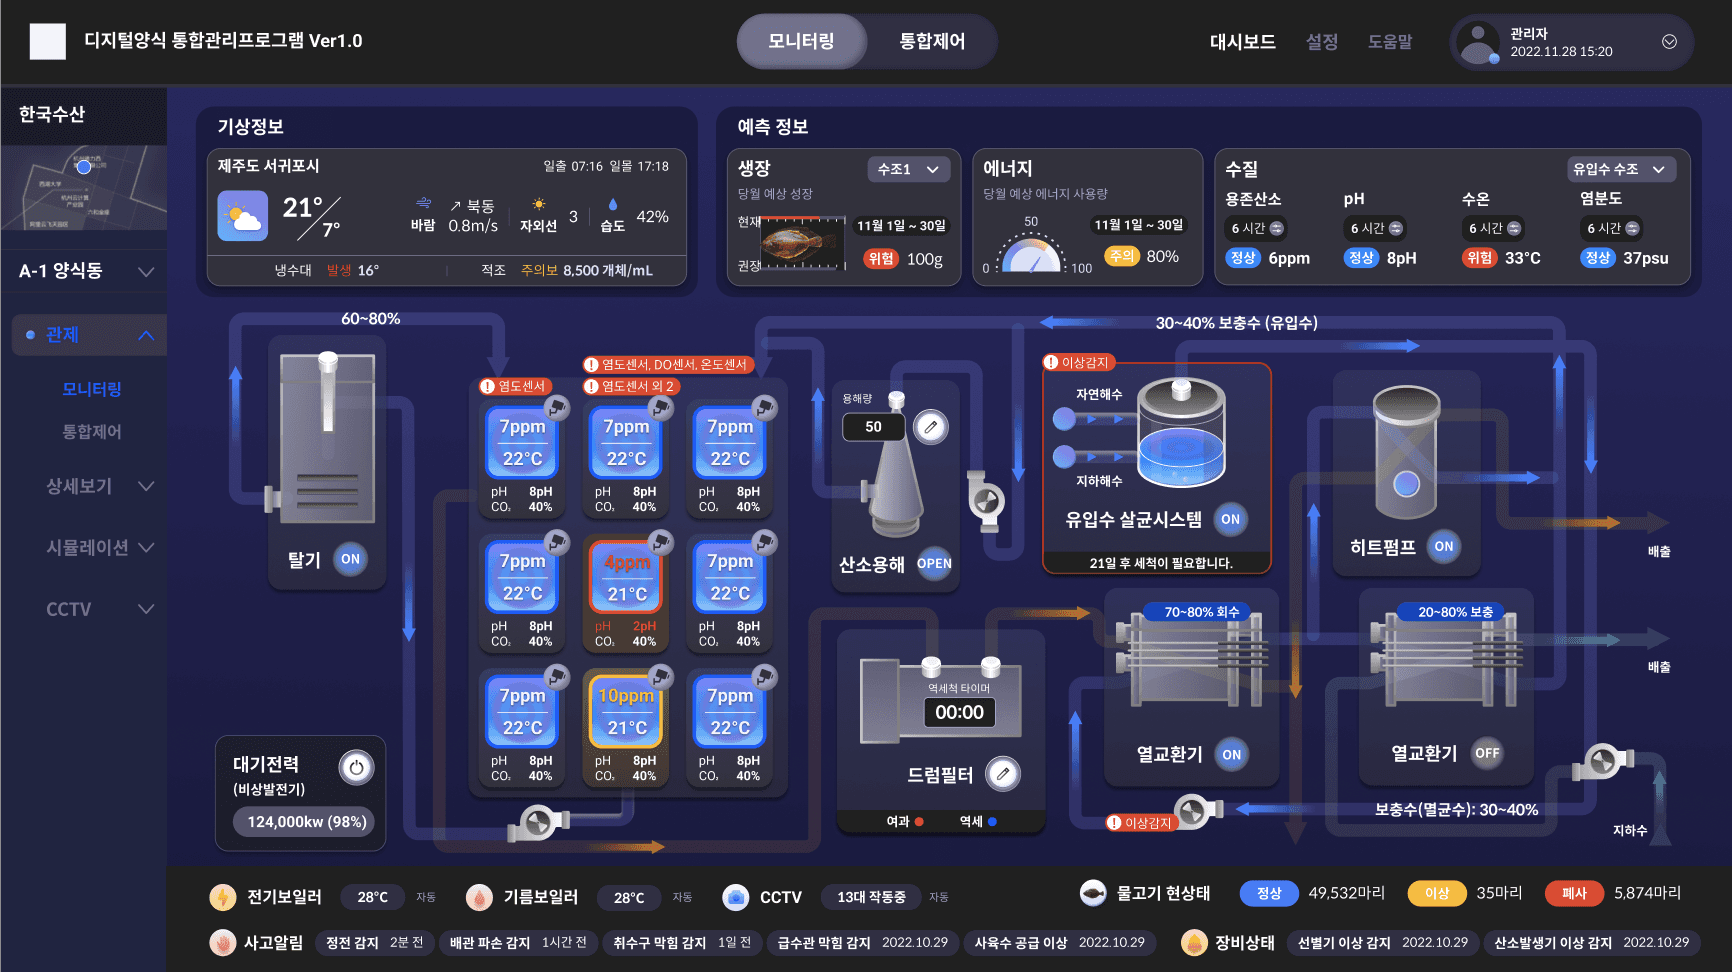
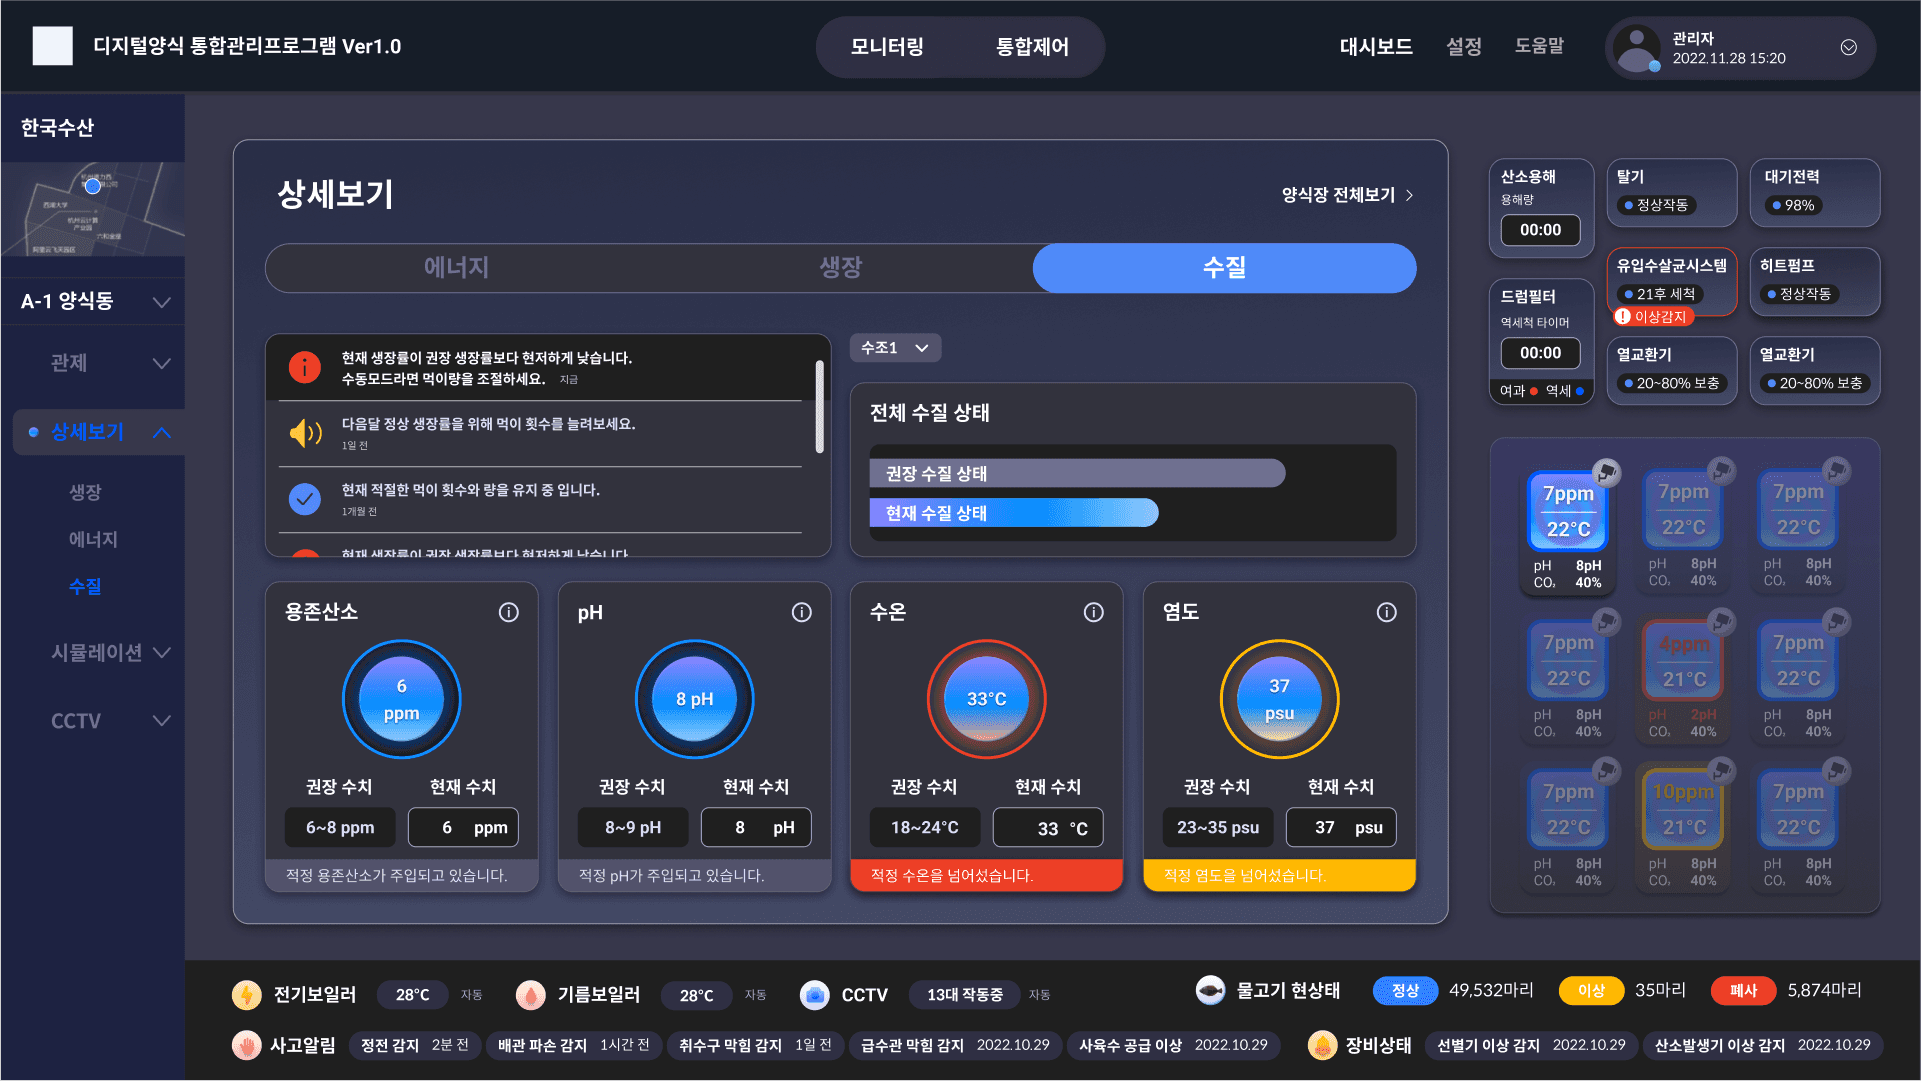
Monitor and control the entire facility on one screen
While operating a smart aquaculture facility, essential functions, elements, and notifications that need frequent monitoring and control are accessible within a single screen.
While operating a smart aquaculture facility, essential functions, elements, and notifications that need frequent monitoring and control are accessible within a single screen.
Common Header
Easily switch monitoring
and integrated control!
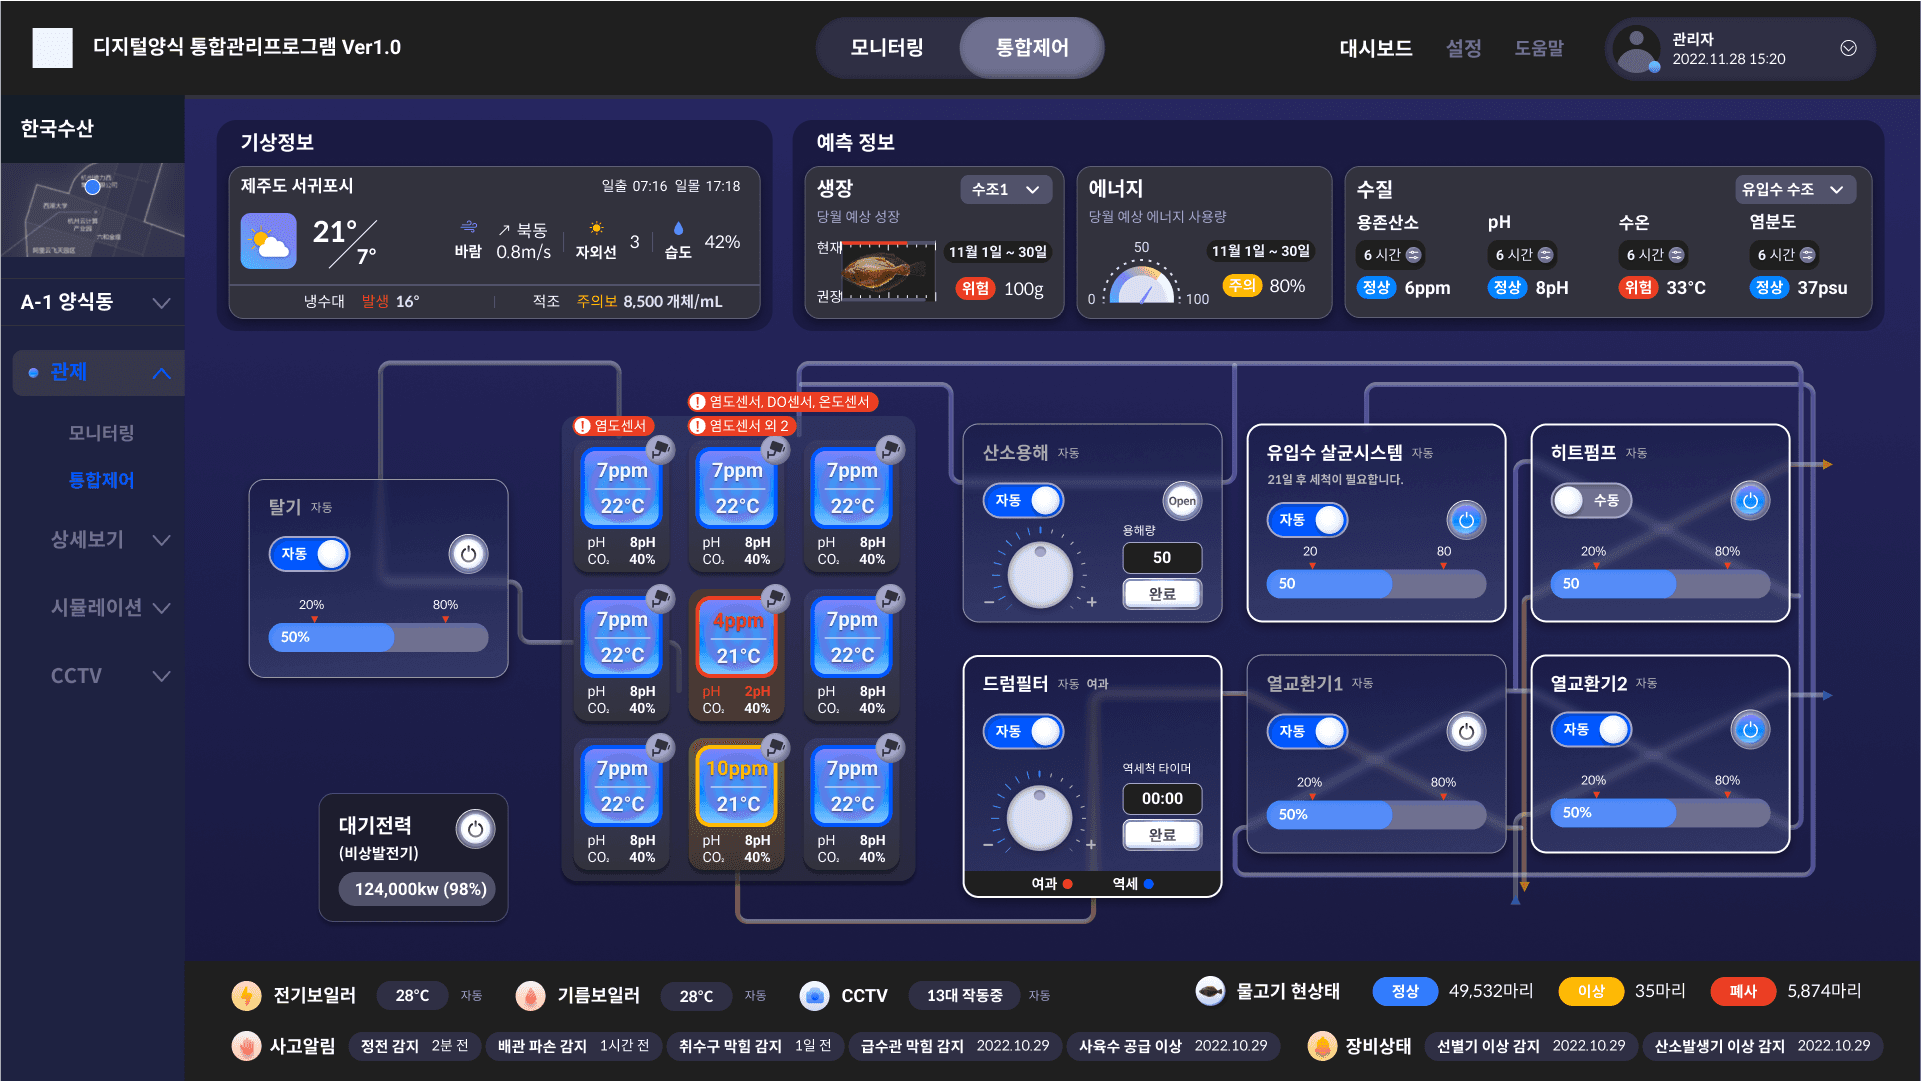
"Monitoring ↔ Integrated Control"
In order to always check the overall facility and operation status while operating a smart aquaculture farm and immediately control any problems, a toggle button was placed at the top to easily switch between the monitoring and integrated control screens. The two pages were designed with a three-dimensional interface to intuitively grasp the facility and operation status.


Main
Simulate what matters
in real time forecasts in real time!
Get a real-time overview of simulated forecasts of growth, energy, and water quality, the variables that have the greatest impact on fish farm operations. Users can refer to this automatic simulation forecast for efficient monitoring and control.
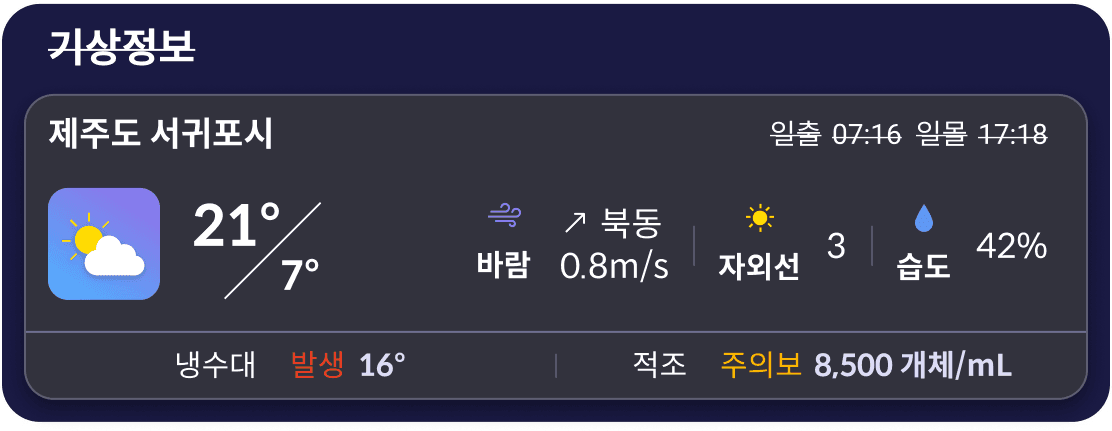
Current weather
information at a glance!
For the aquaculture industry, where weather conditions are critical, you can see weather information for your current location instantly from the main control page.

Main - Monitoring 01
The entire
aquaculture facility
and tank status at
a glance!
You can see the status of all the equipment and tanks in your aquaculture wing at a glance, and selecting each device puts the corresponding equipment area into control mode for immediate control.
Boiler, CCTV, Fish Status, Incident Notification, Equipment Status

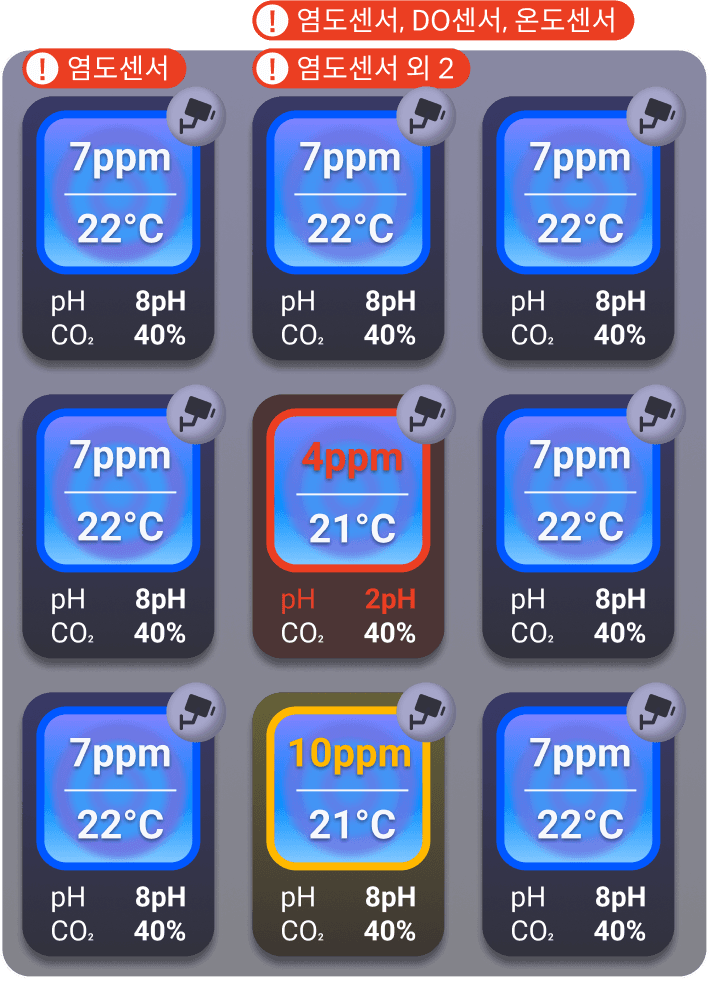
Main - Monitoring 02
Main - Monitoring 03
Intuitively check the status
of all tanks in your aquaculture farm!
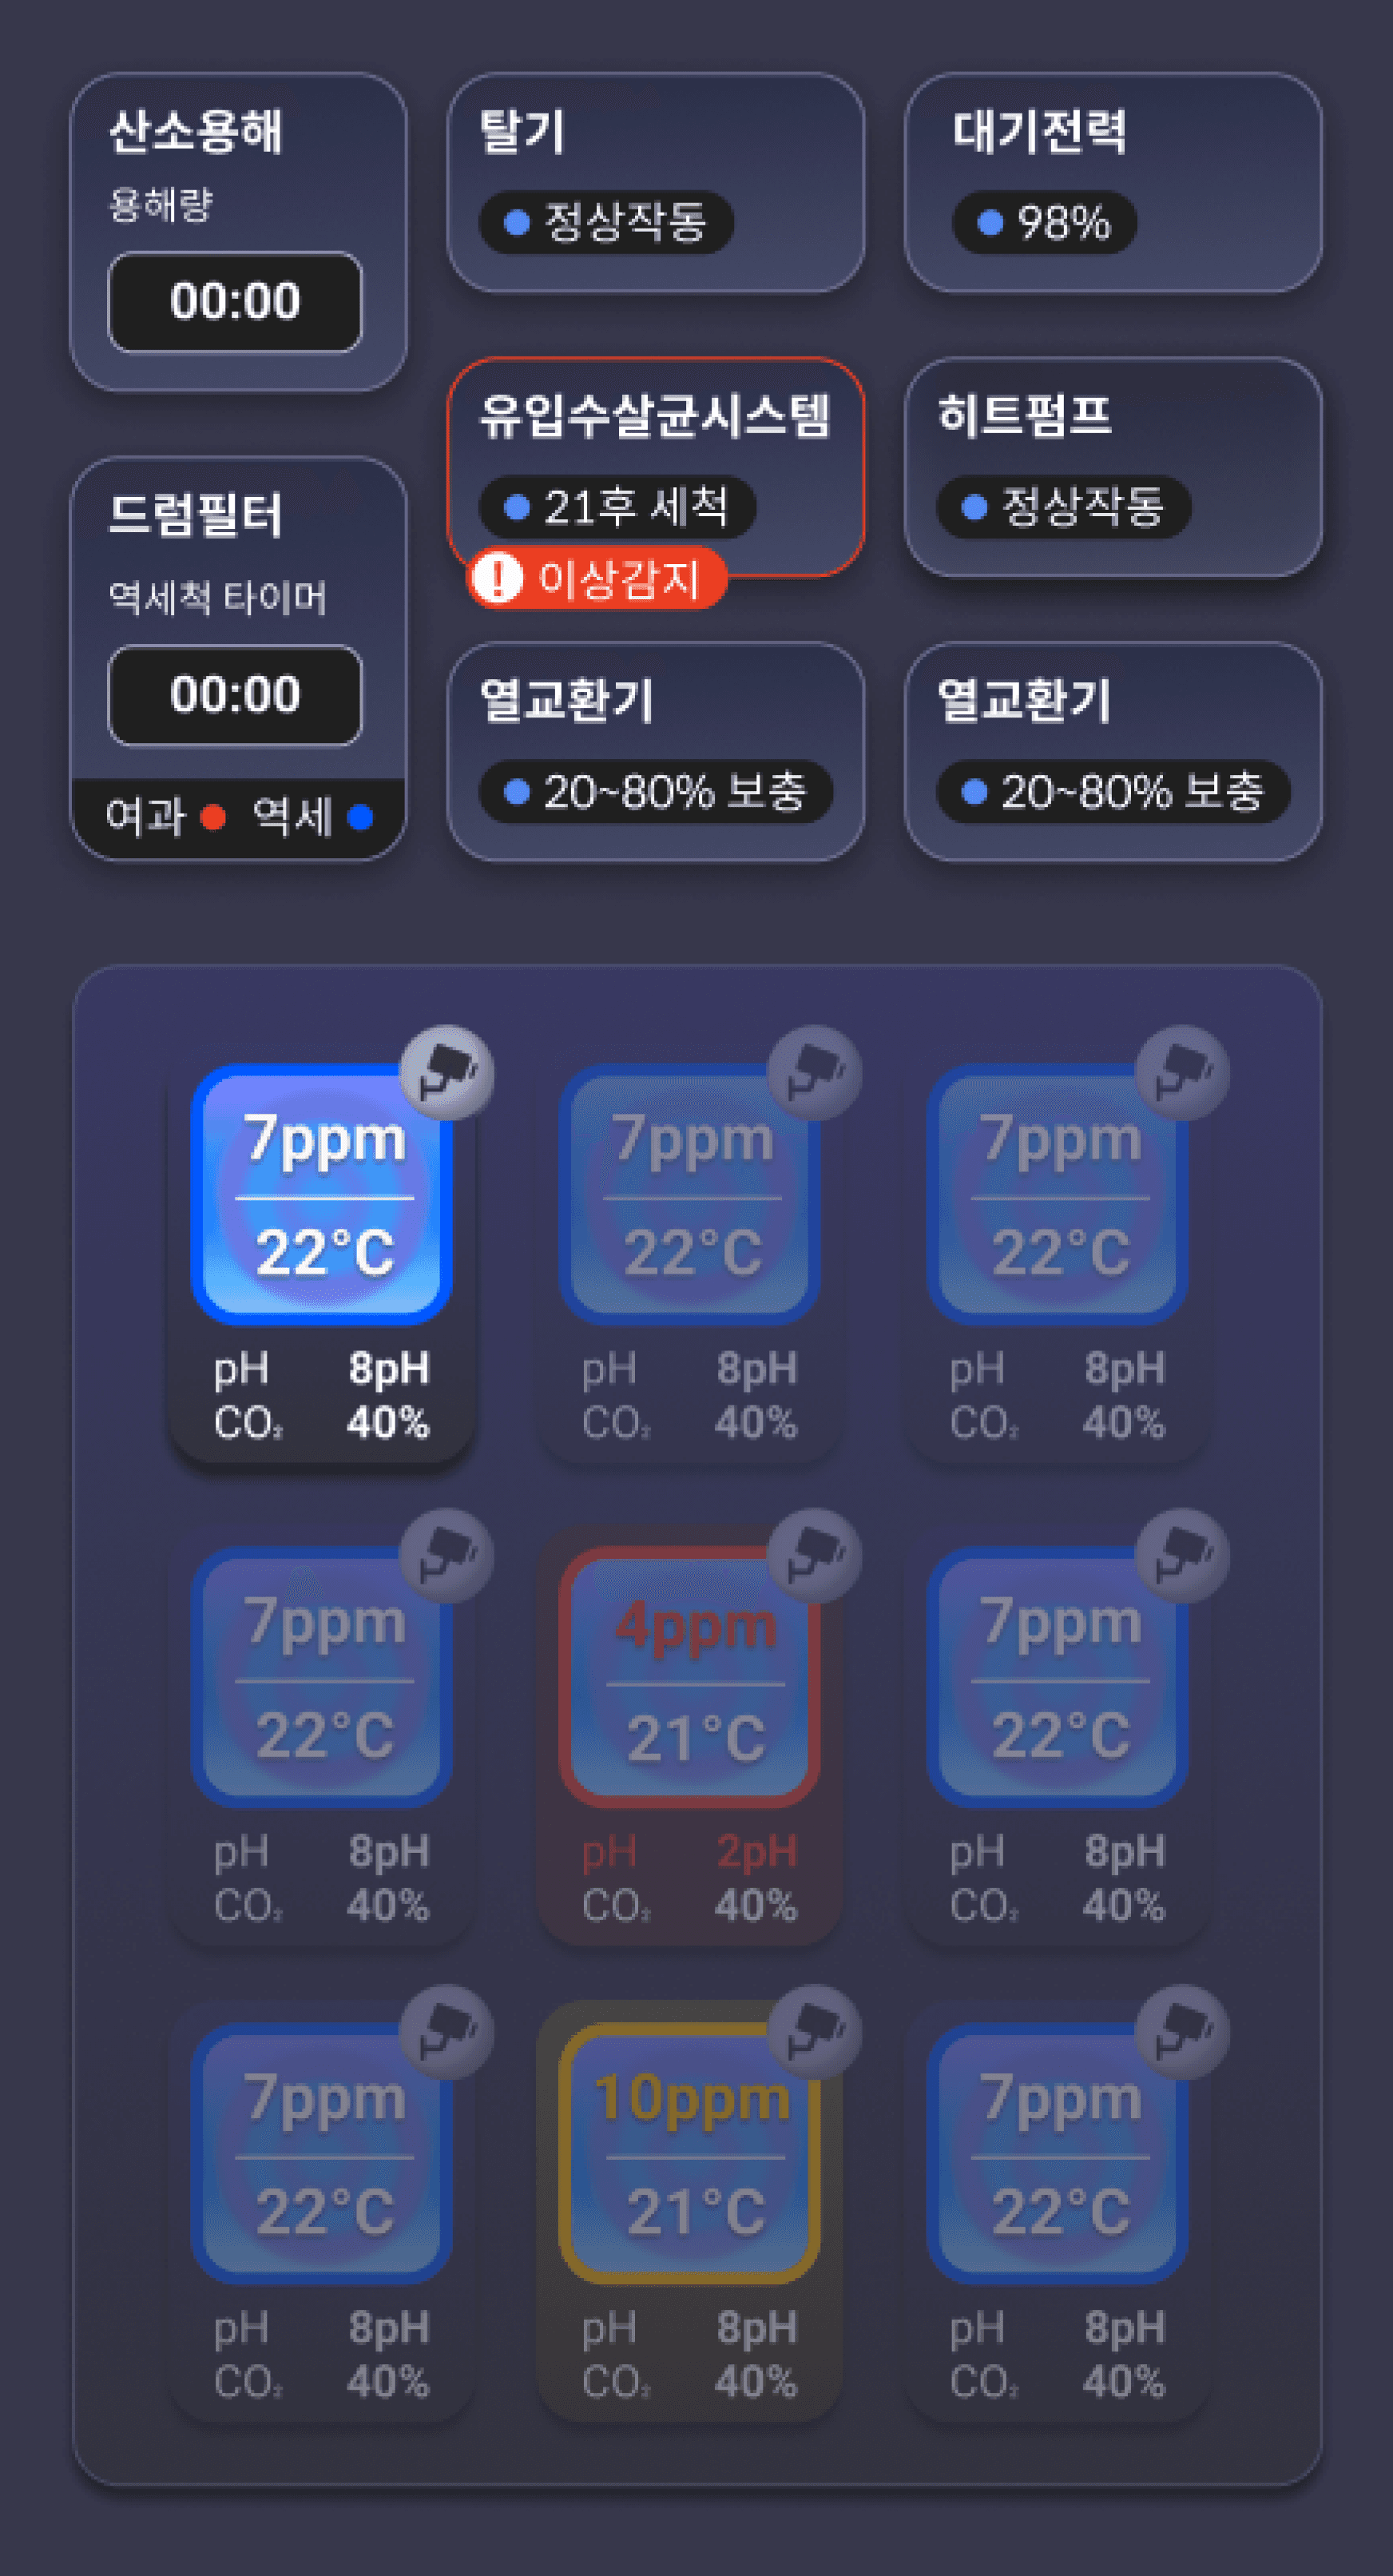
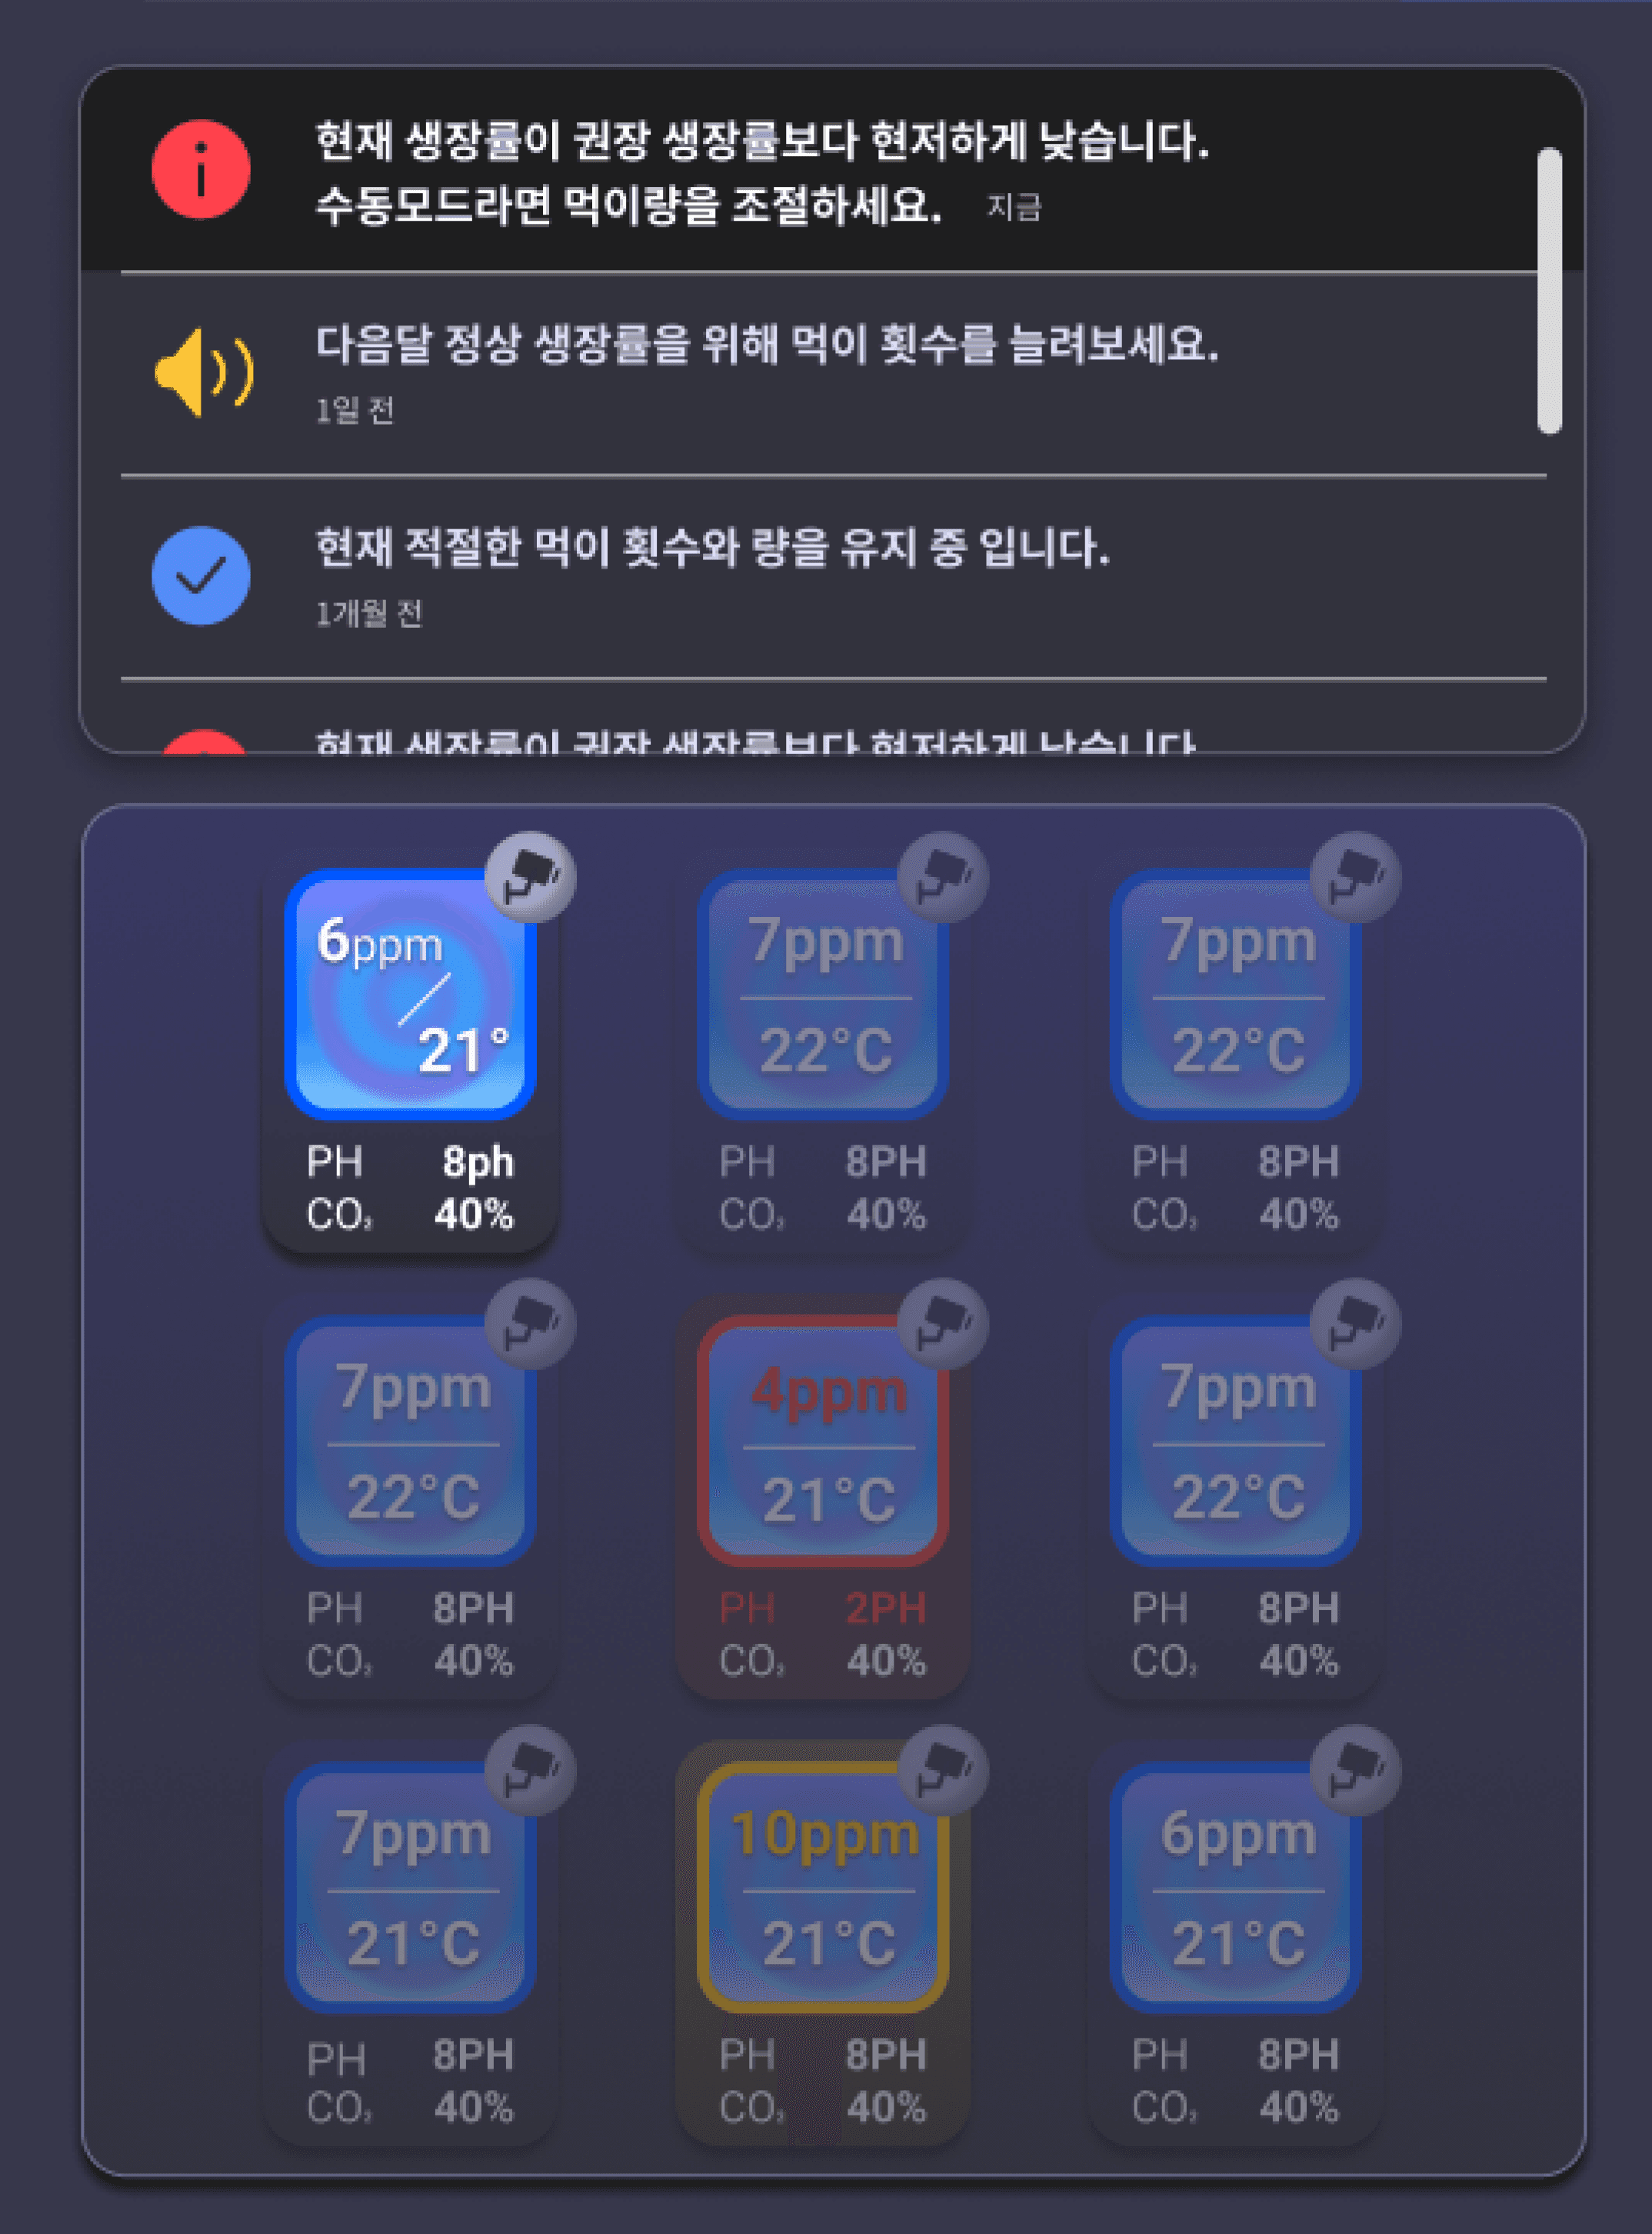
You can instantly see the status of all tanks in the aquaculture wing in color and numbers, and each tank has a CCTV button so you can see what the tanks actually look like when you need to.
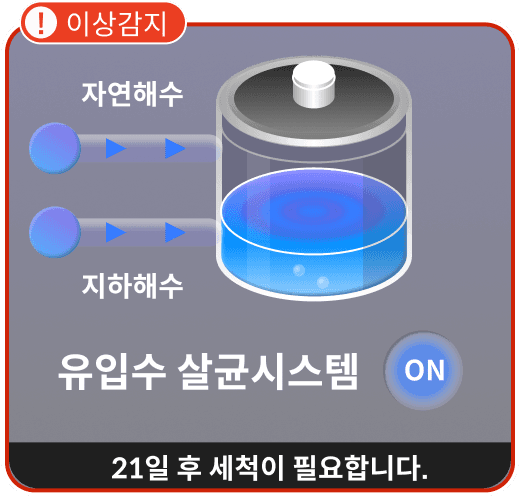
Intuitive exposure
in case of abnormality
detection


Numerical
control
in an instant!
Instantly turn standby power
On/Off instantly!
Main - 통합제어
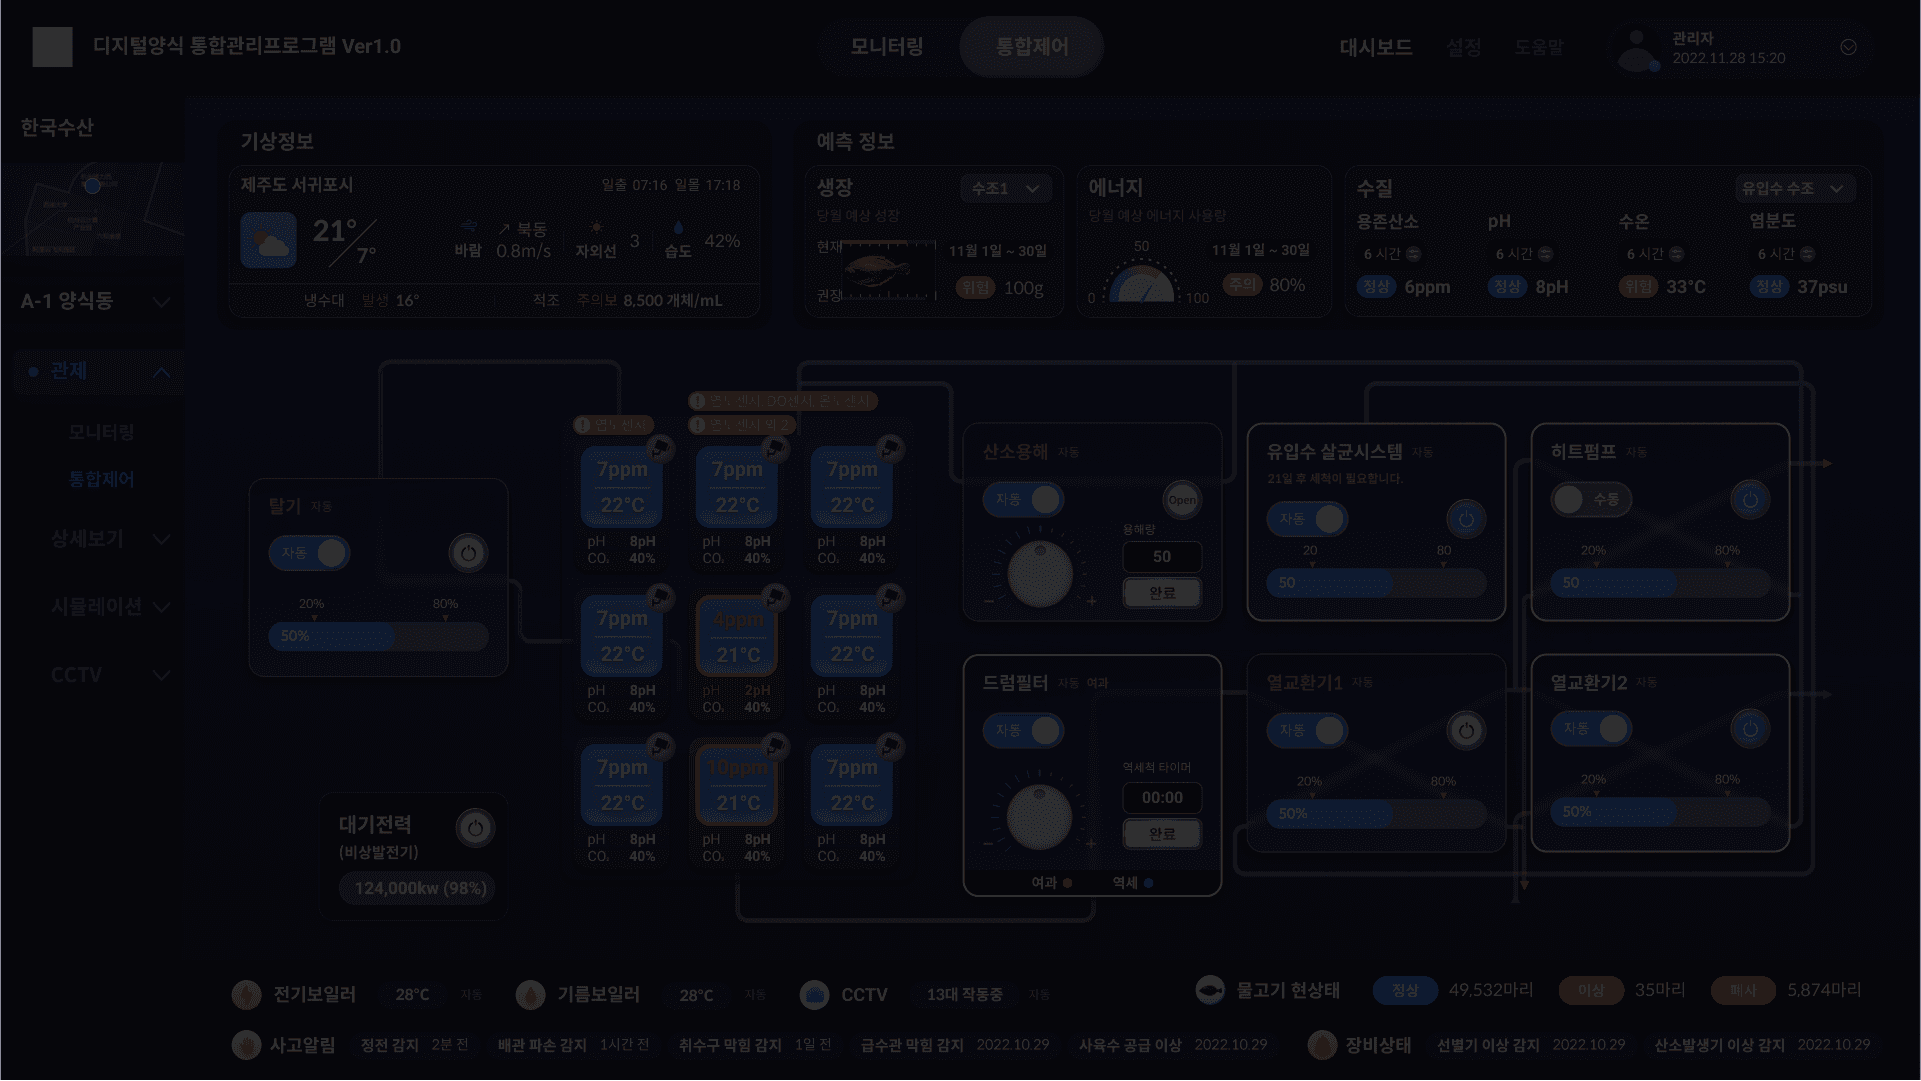
Immediate control with accurate figures!
You can intuitively control detailed facilities such as oxygen dissolution facilities and liquid washing timers of drum filters using three-dimensional buttons.
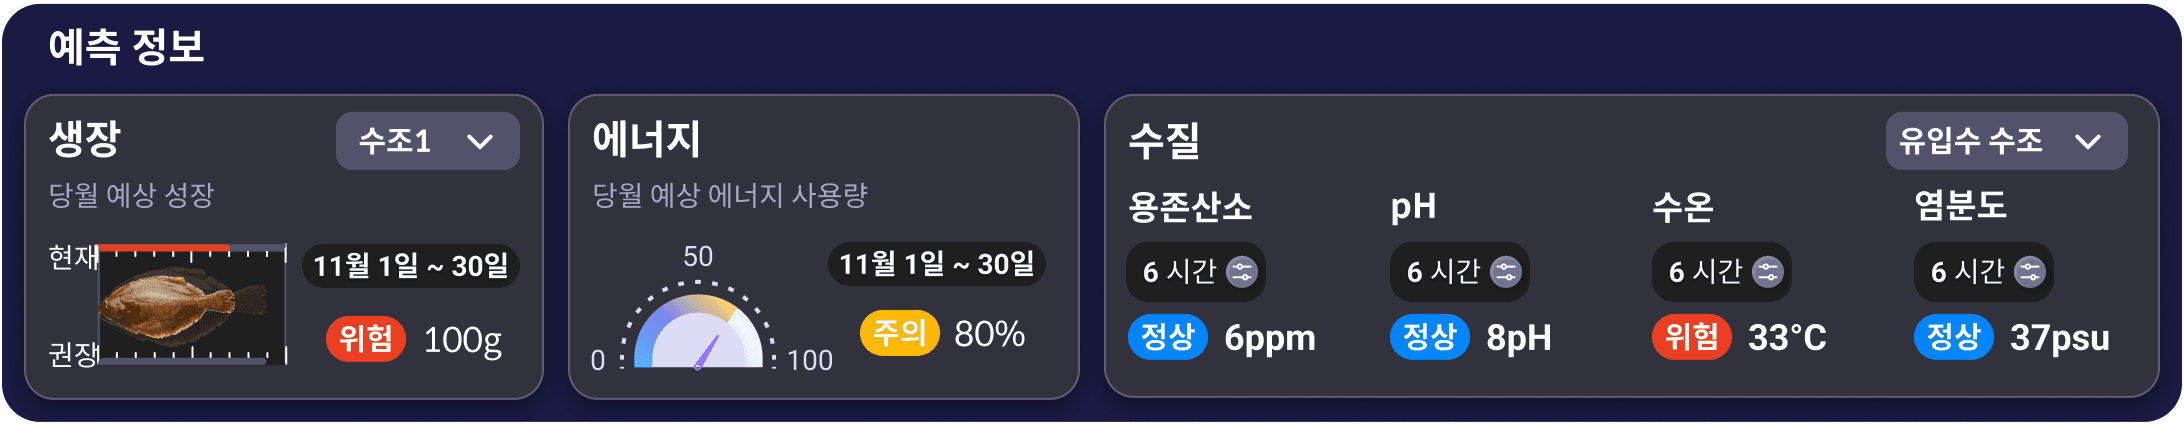
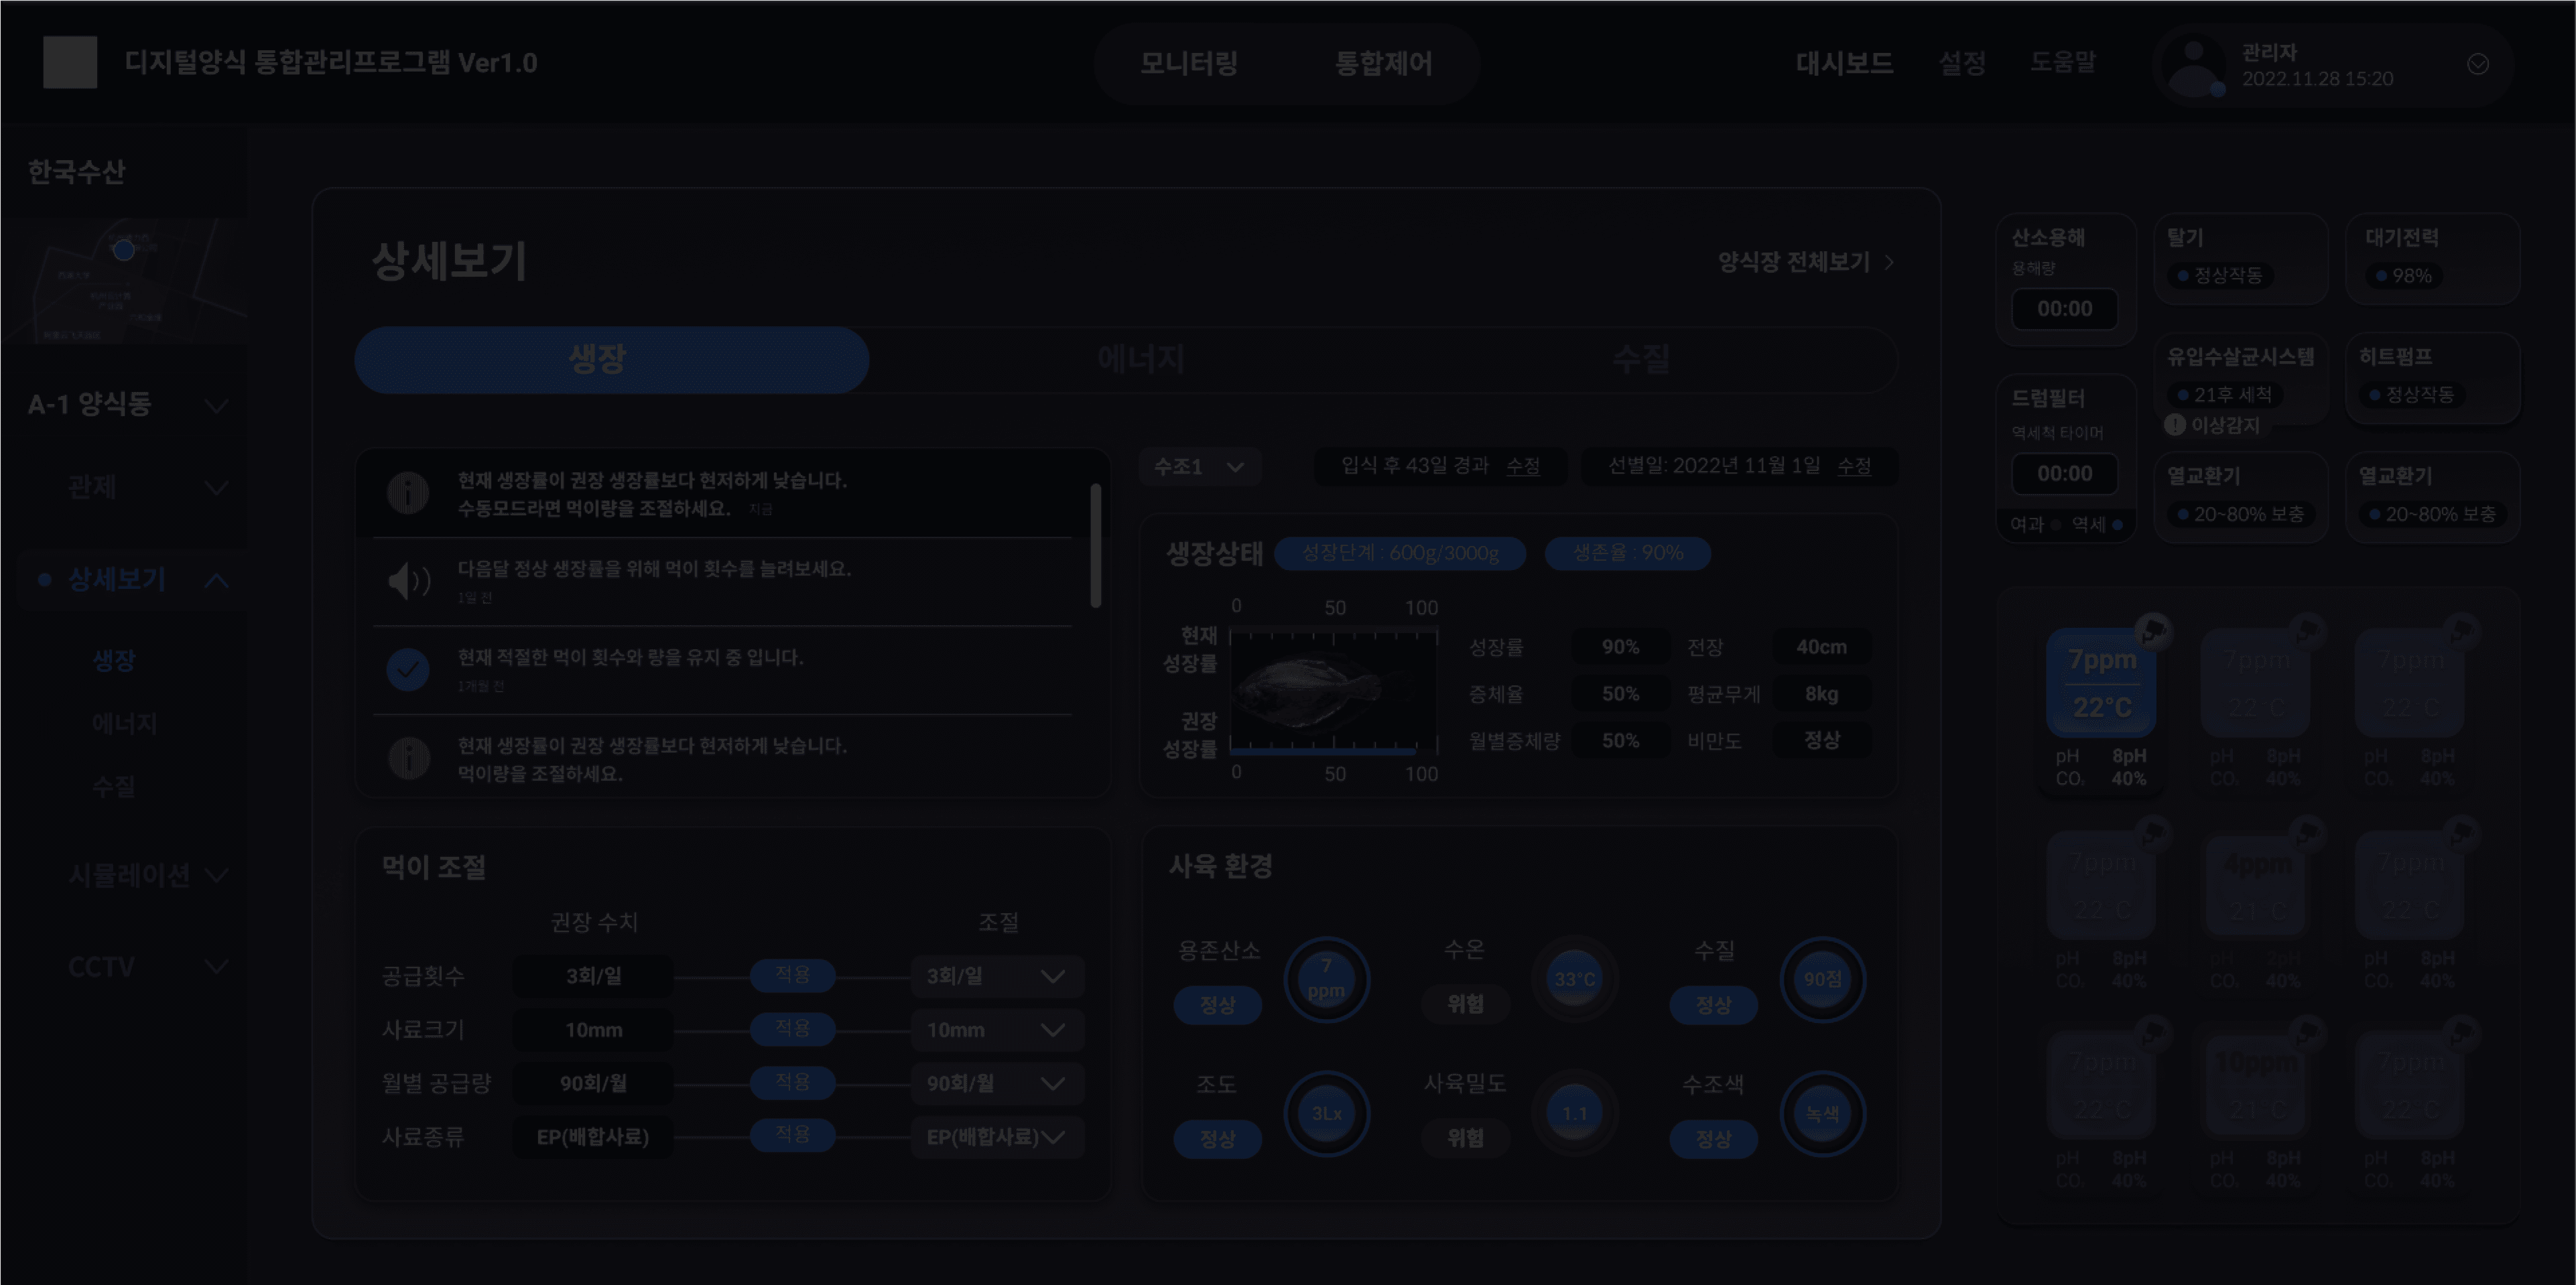
View details
View details
Intuitively check
growth, energy,
and water quality data
Intuitively check
growth, energy, and
water quality data
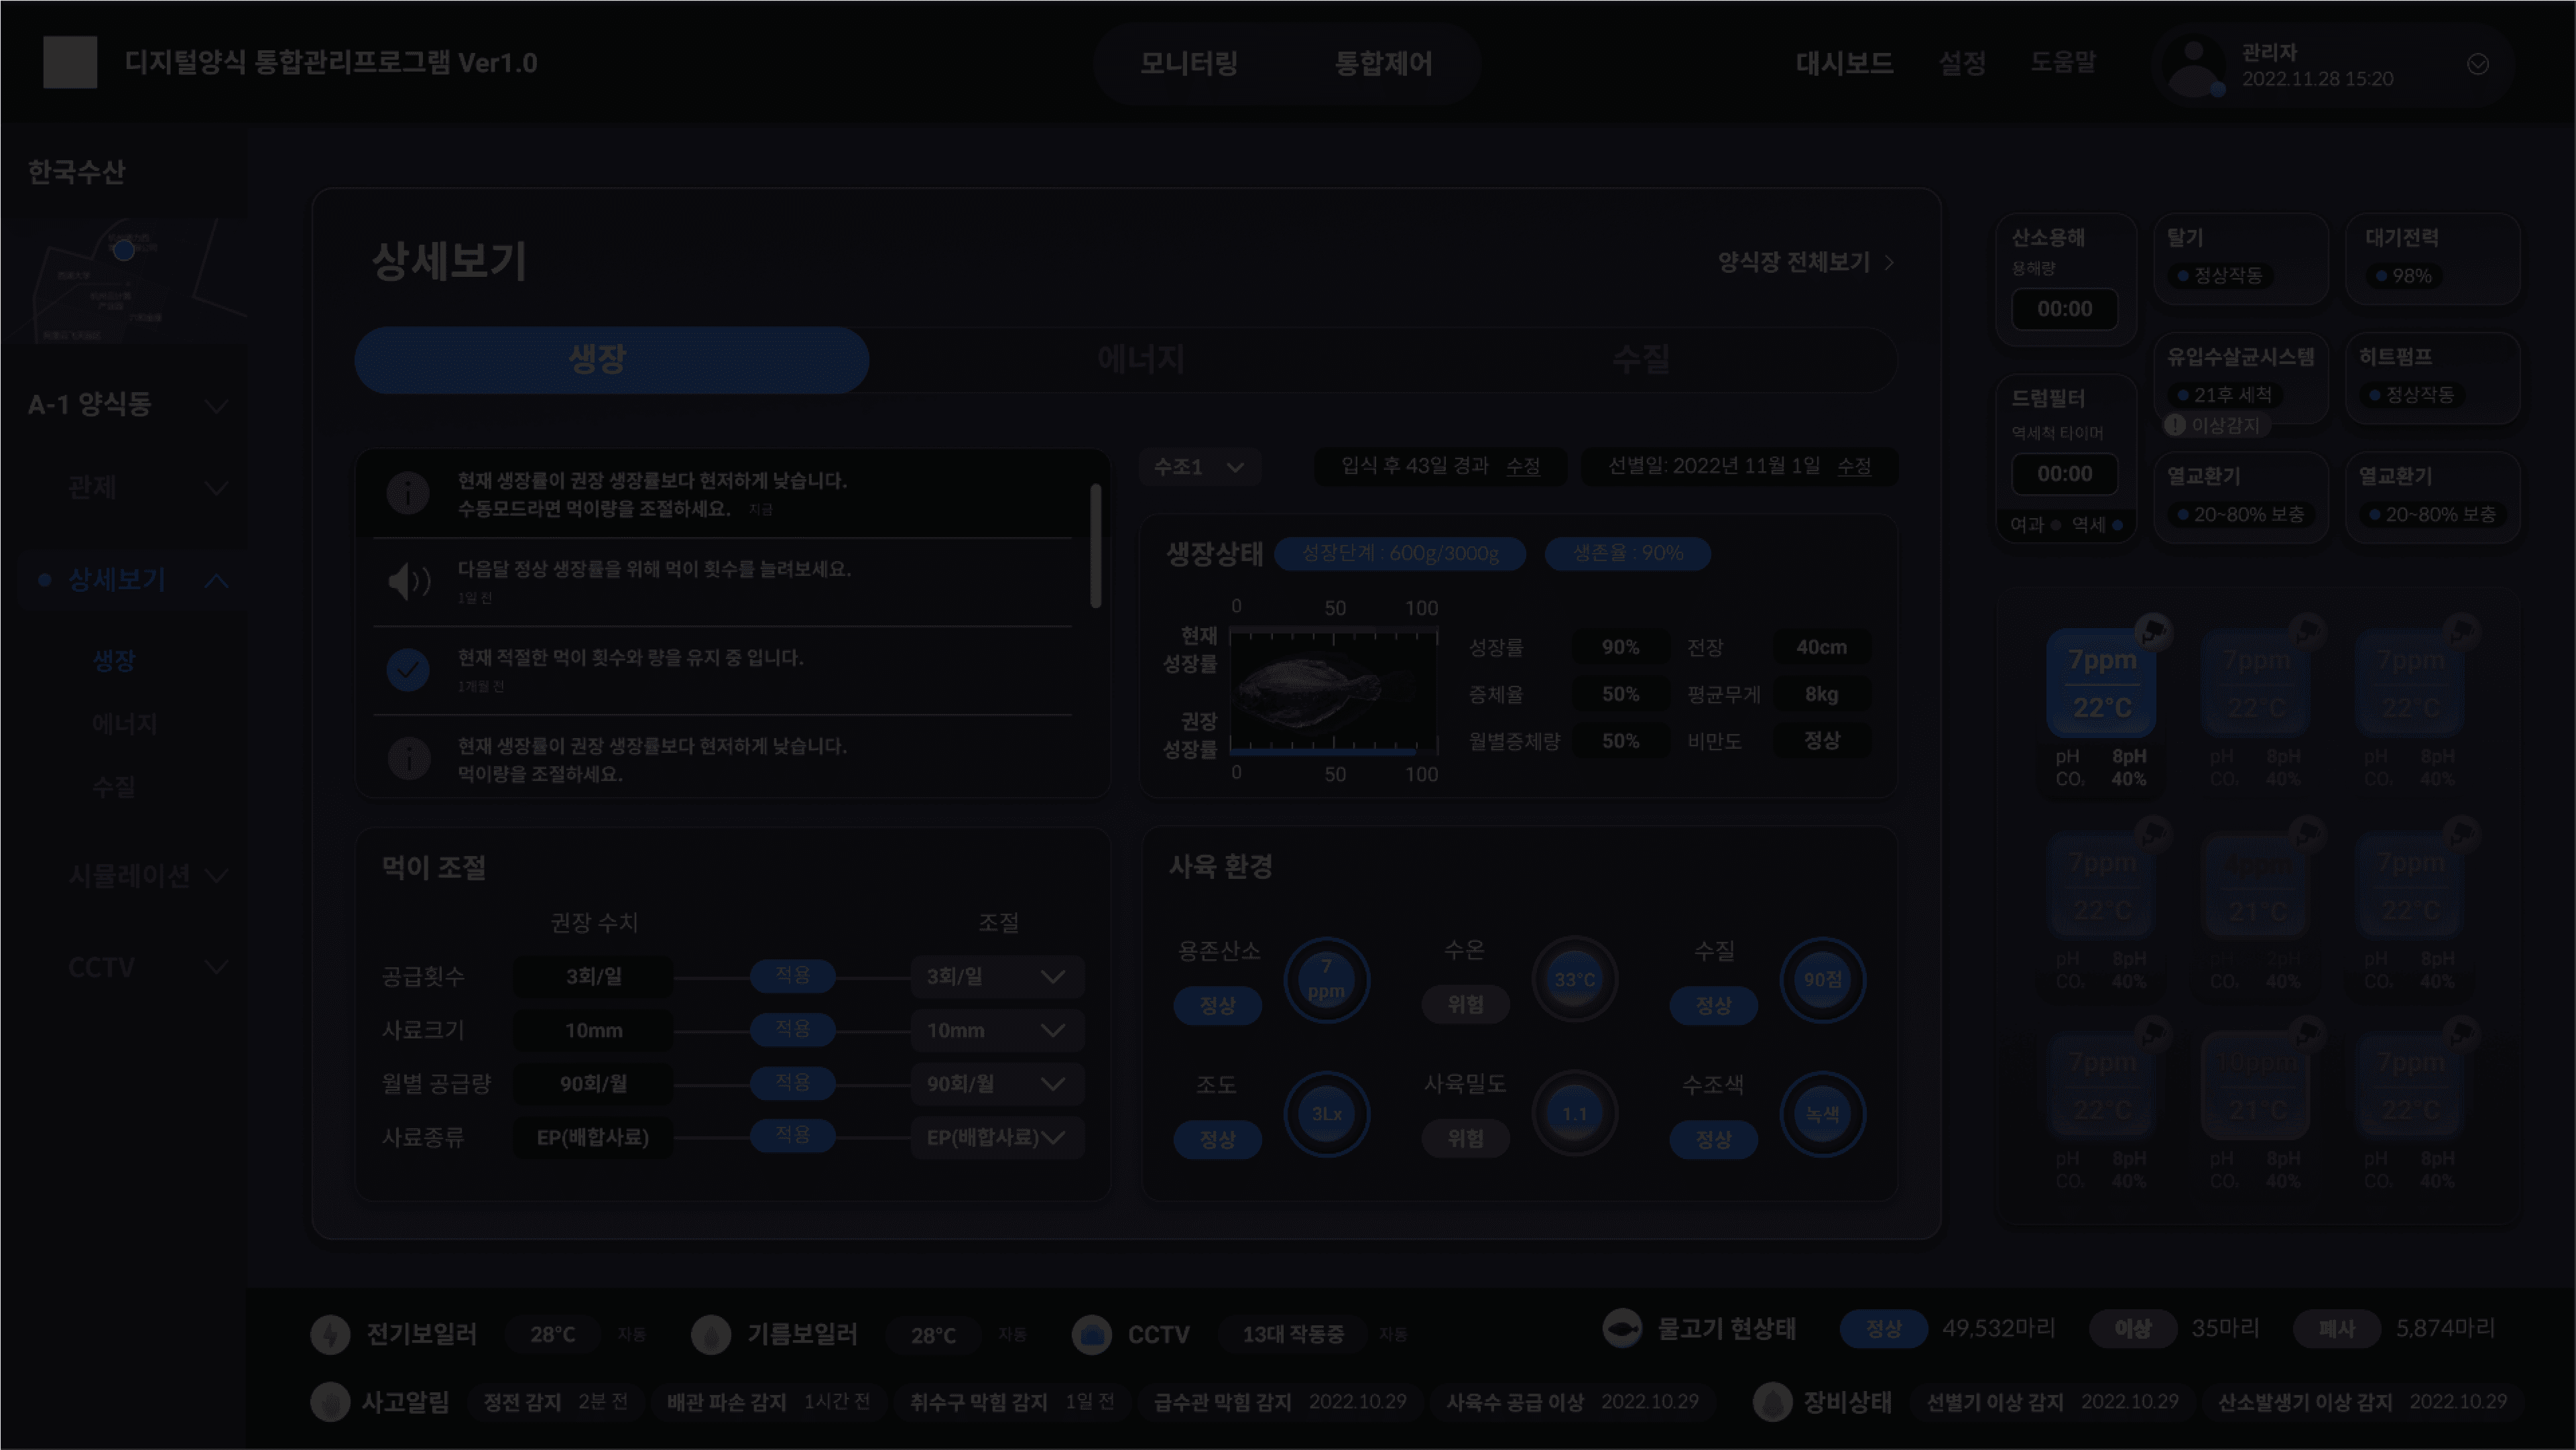
Intuitively check
growth, energy, and
water quality data
The most crucial variables for smart aquaculture operation, such as growth, energy, and water quality data, are easily understood, predicted, and controlled through an intuitive interface.
The most crucial variables for smart aquaculture operation, such as growth, energy, and water quality data, are easily understood, predicted, and controlled through an intuitive interface.

View details
Checking the full summary
of the farm even while
checking the details!
Instead of complex data
graphs, intuitive data analysis
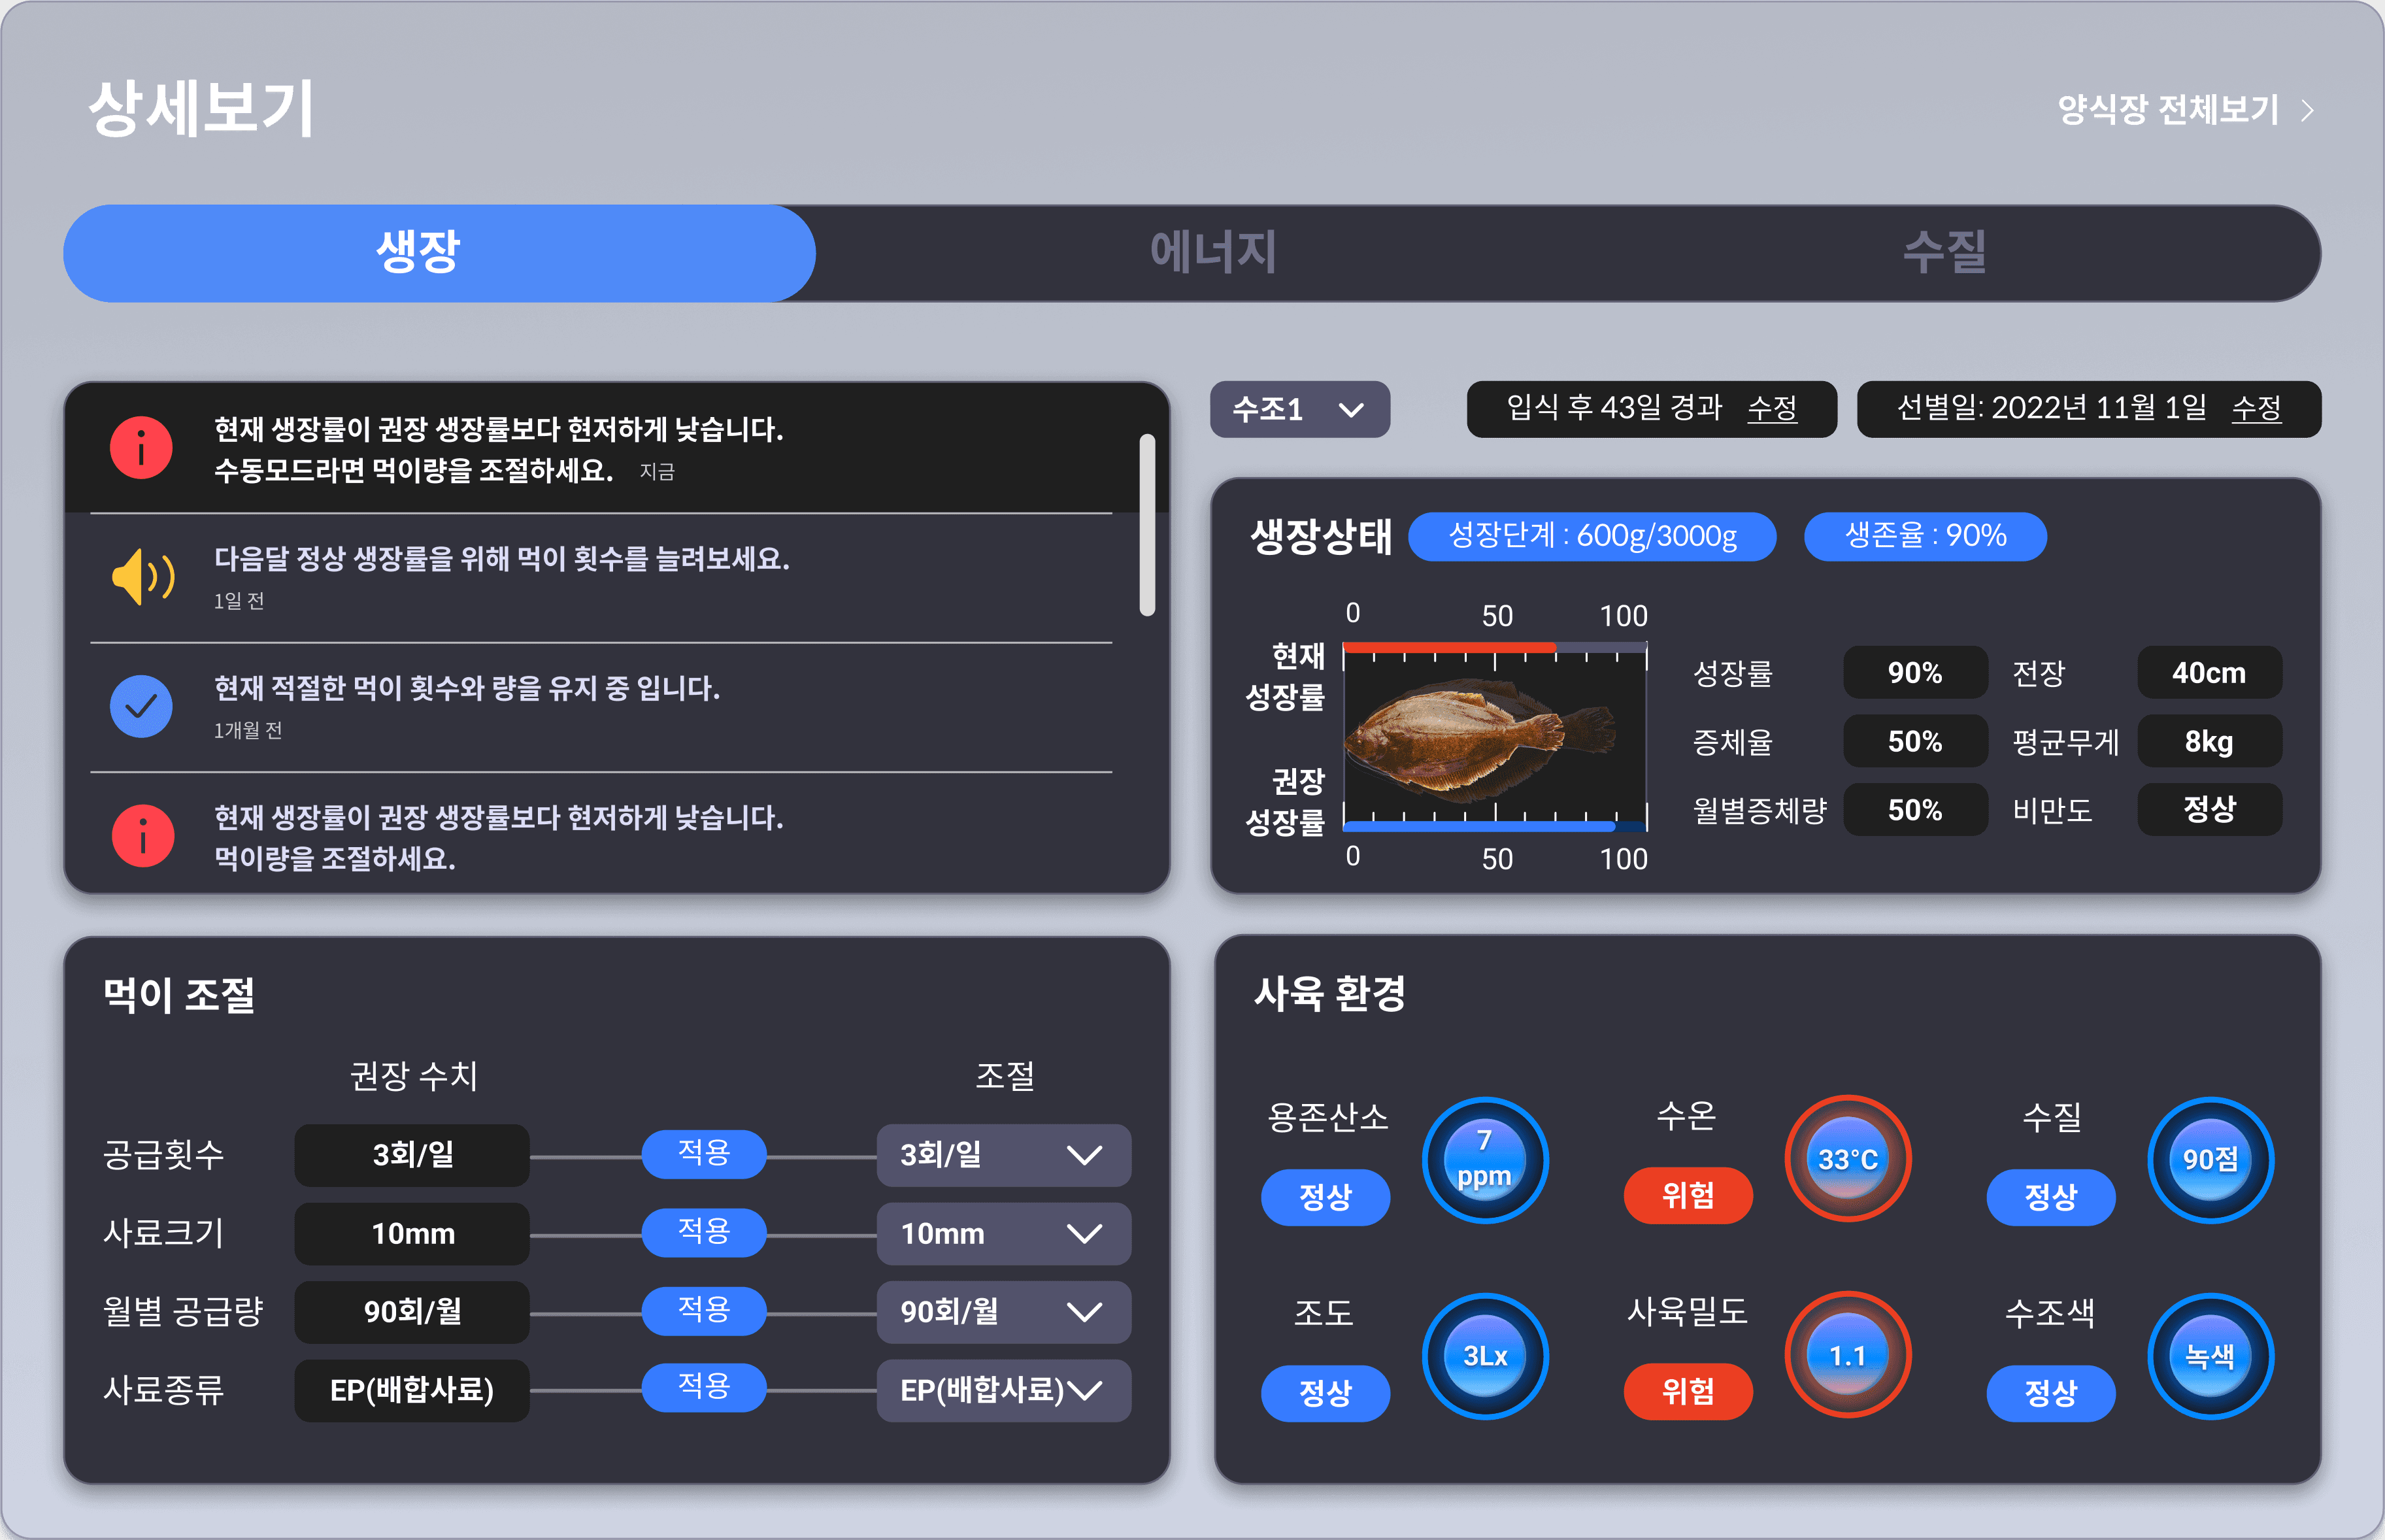
물고기의 미래 생장 예측 데이터를
직관적으로 확인하고 바로 적용!
물고기의 현재 생장 상태뿐만 아니라 미래의 생장에 영향을 미치는 다양한 변수들을 고려하여 예측하고, 사용자에게 제공합니다. 사용자들은 프로그램에서 제안하는 수치를 기반으로 변수를 조절할 수 있습니다.
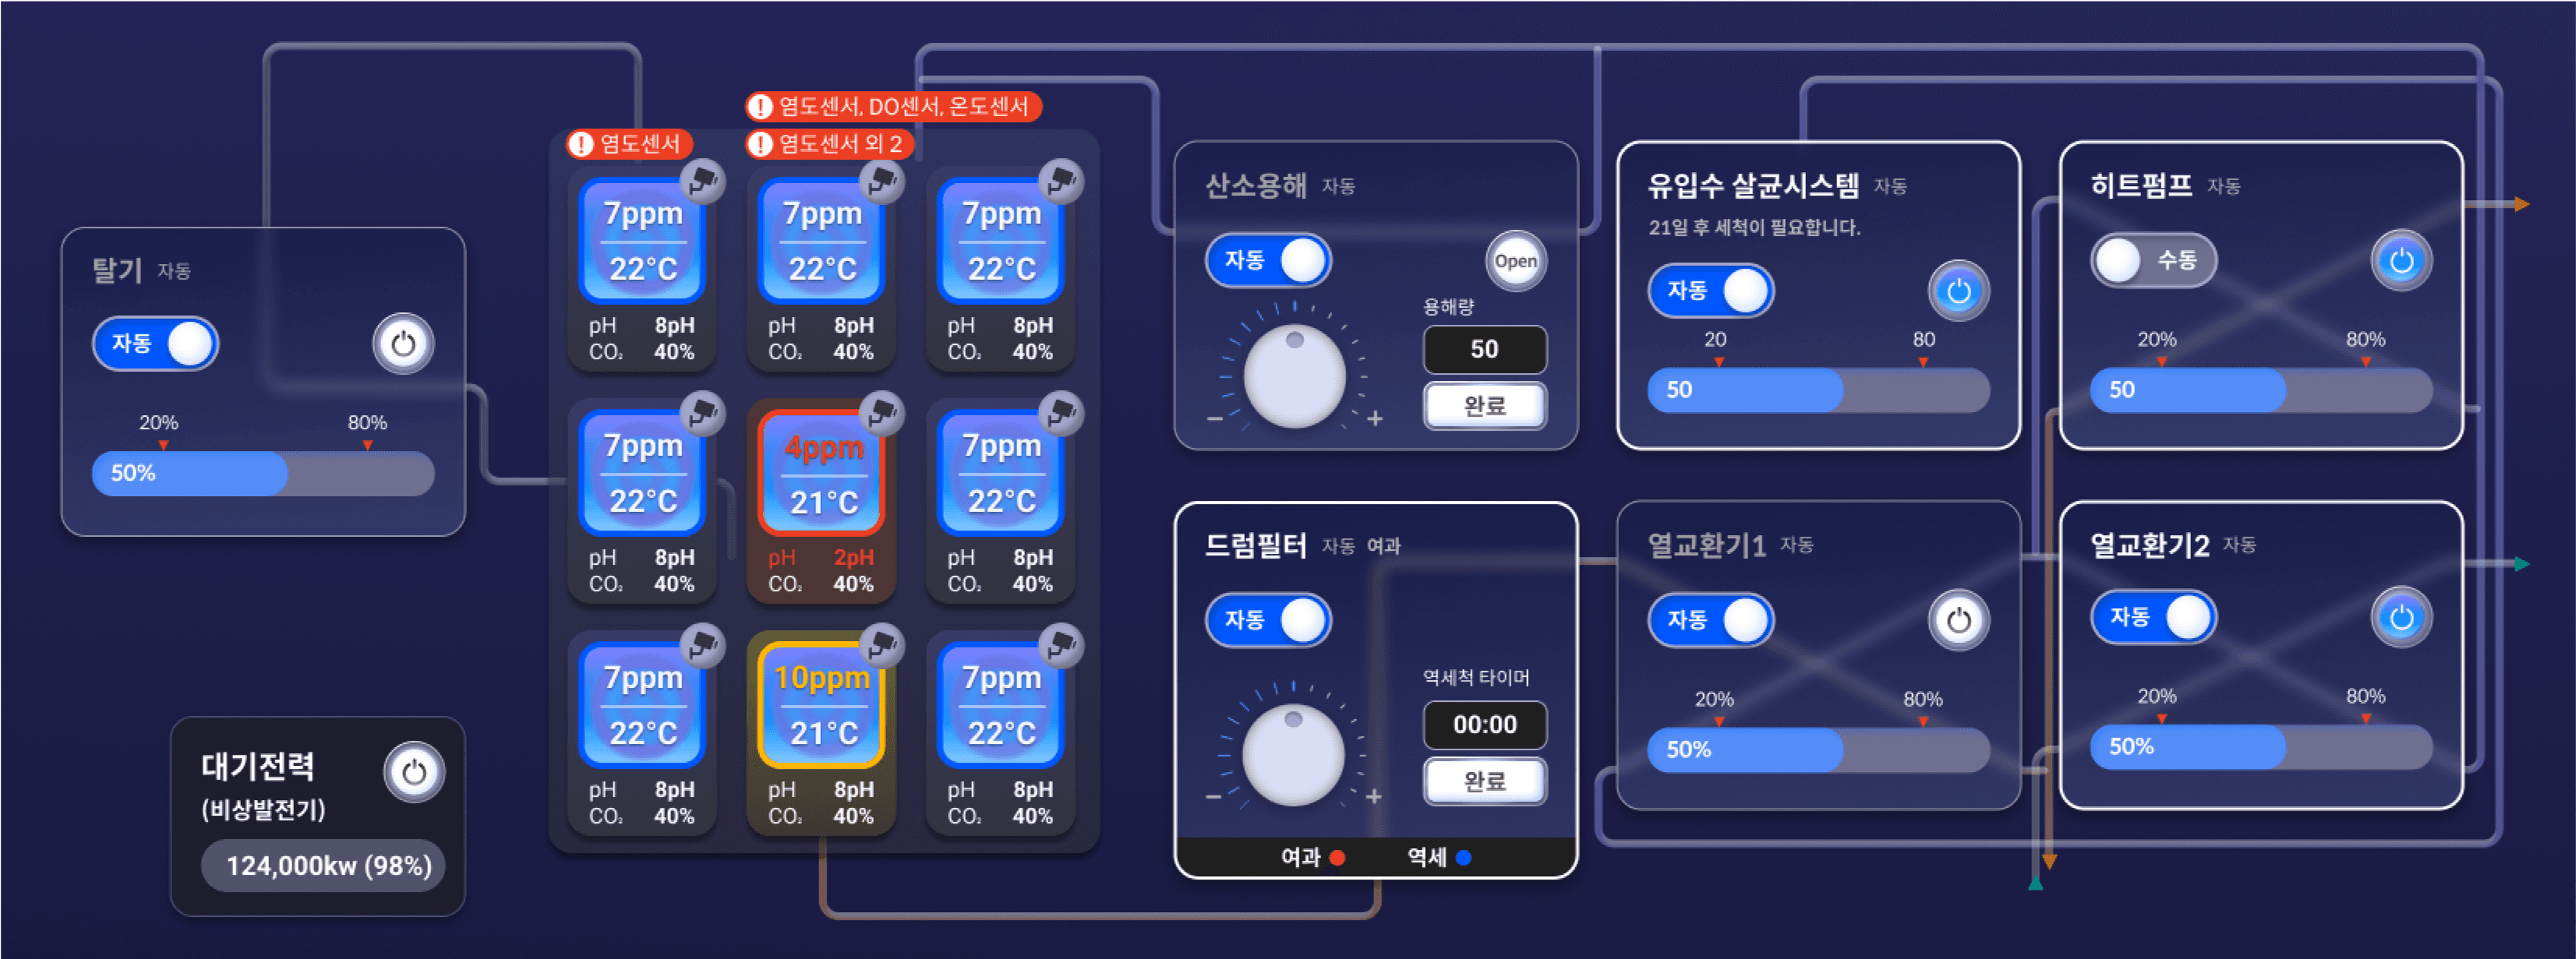
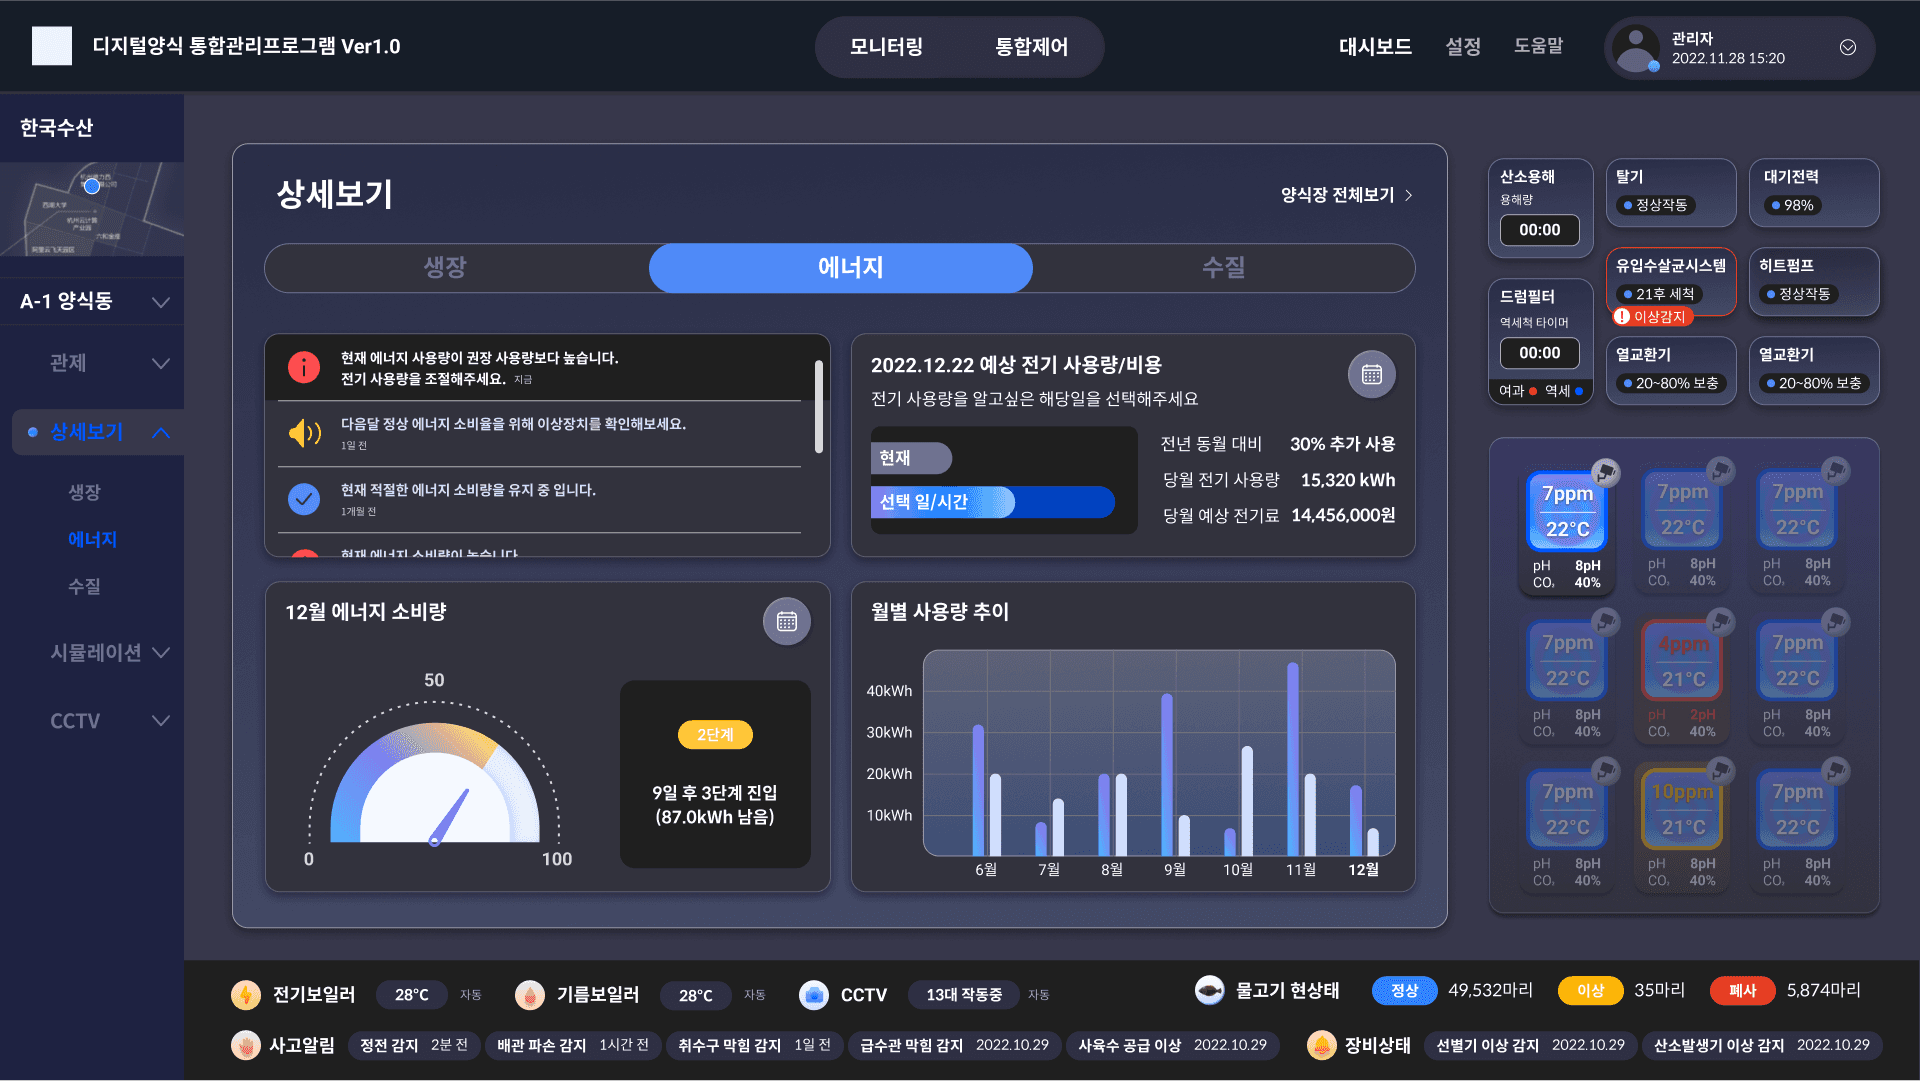
상세보기 - 생장
과거, 현재, 미래 에너지 사용량과 비용을
모두 확인가능!
과거와 현재의 에너지 사용량을 모니터링할 뿐만 아니라, 원하는 미래 기간을 설정하면 해당 기간에 예상되는 에너지 사용량과 비용까지 확인할 수 있습니다.
모든 데이터는 직관적인 그래프로 디자인되어 사용자가 쉽게 이해할 수 있습니다.
상세보기 - 에너지

수질을 좌우하는 변수를 직관적으로 확인!
수질을 좌우하는 주요 변수인 용존산소, pH, 수온, 염도의 현재 수치와 권장 수치를 함께 제시하며, 문제 발생 시 명확한 색상 구분으로 사용자가 직관적으로 수질 관리를 할 수 있도록 만들어졌습니다.
상세보기 - 수질

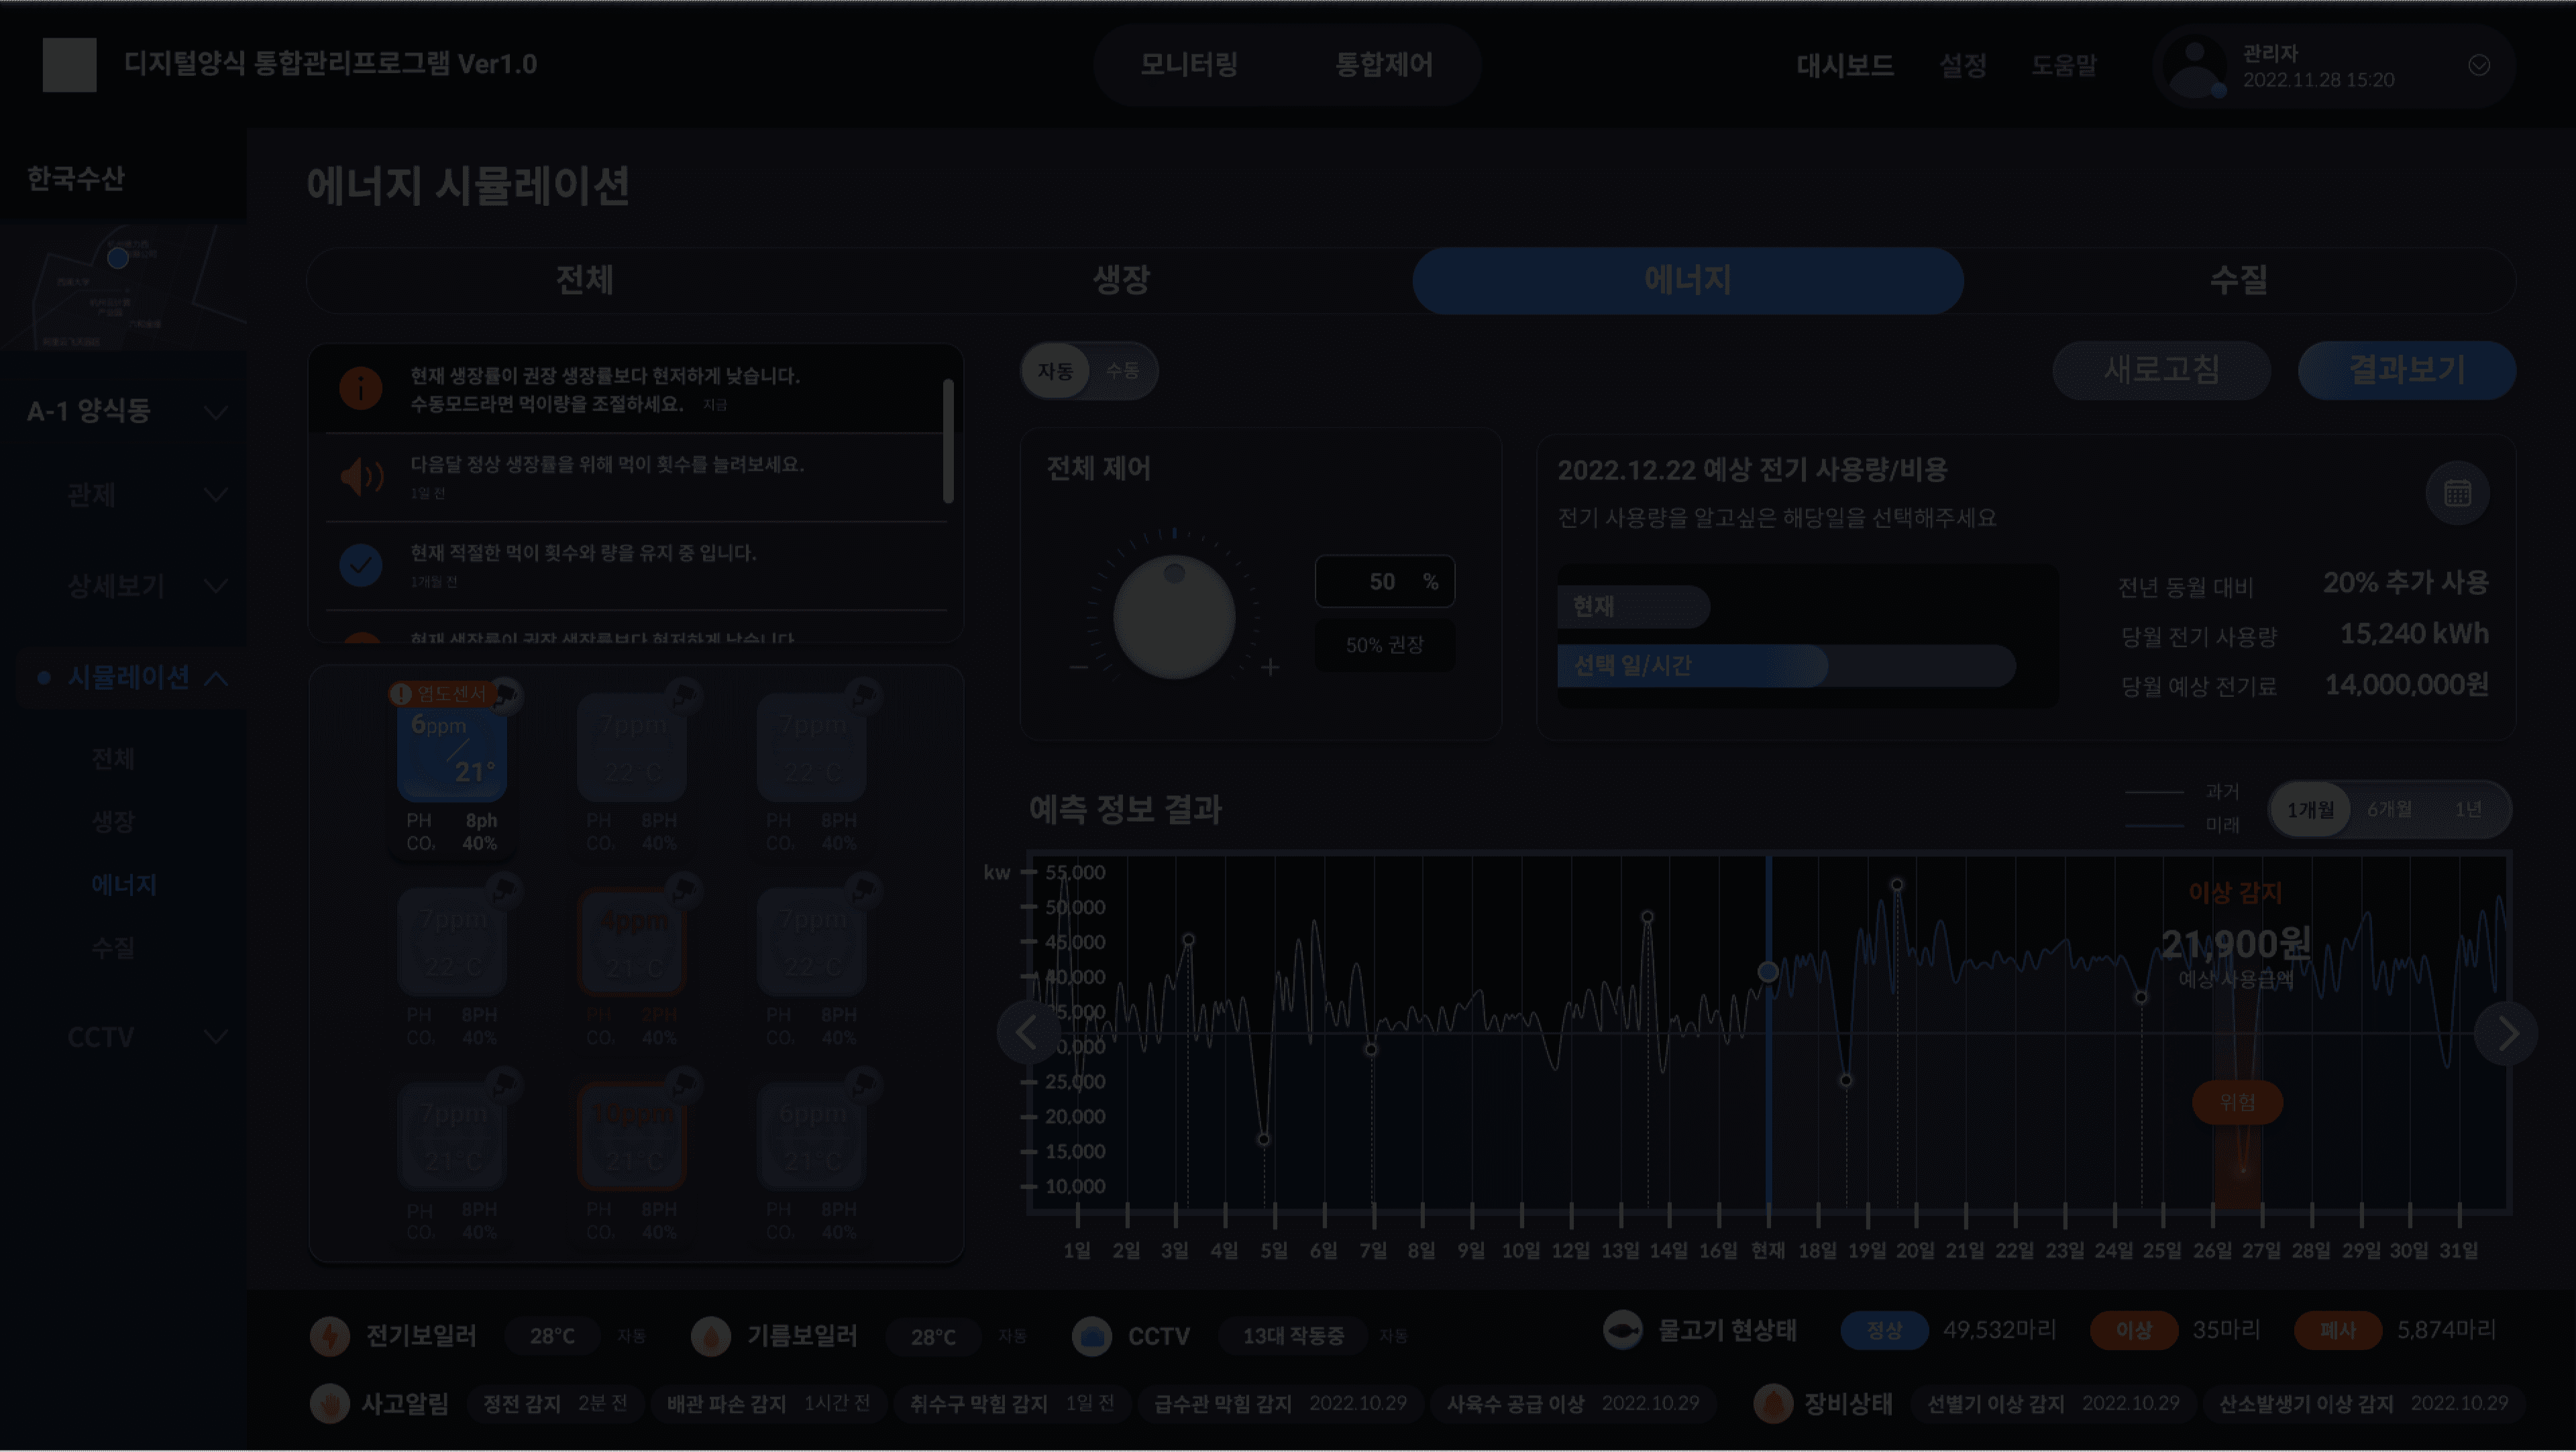
Simulation
Simulation
It's not difficult.
Easy and fast simulation
It's not difficult.
Easy and fast
simulation
It's not difficult.
Easy and fast
simulation
We designed the simulation feature, a core function of the Digital Twin Smart Aquaculture, to be easily understood and applied by a wide range of users. Users can freely check predicted values by applying various variables.
We designed the simulation feature, a core function of the Digital Twin Smart Aquaculture, to be easily understood and applied by a wide range of users. Users can freely check predicted values by applying various variables.
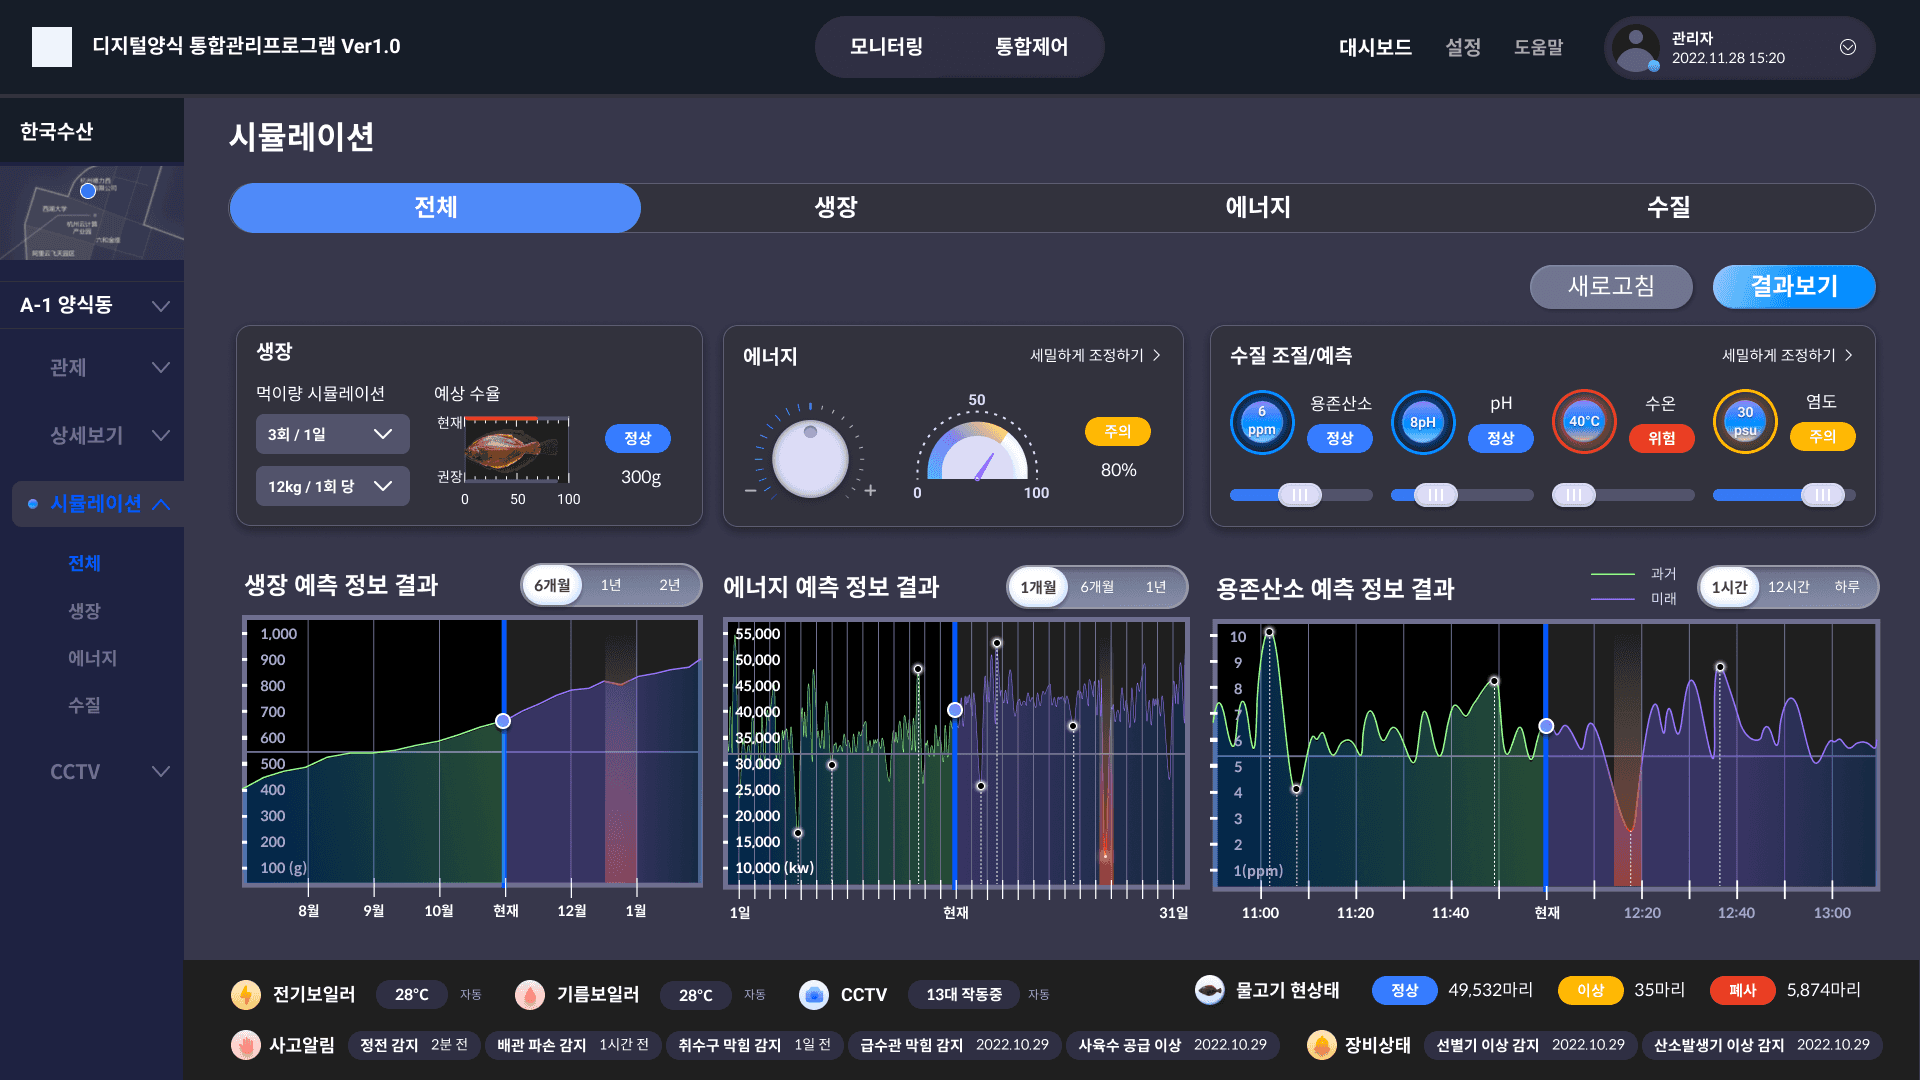

Simulation - Overall
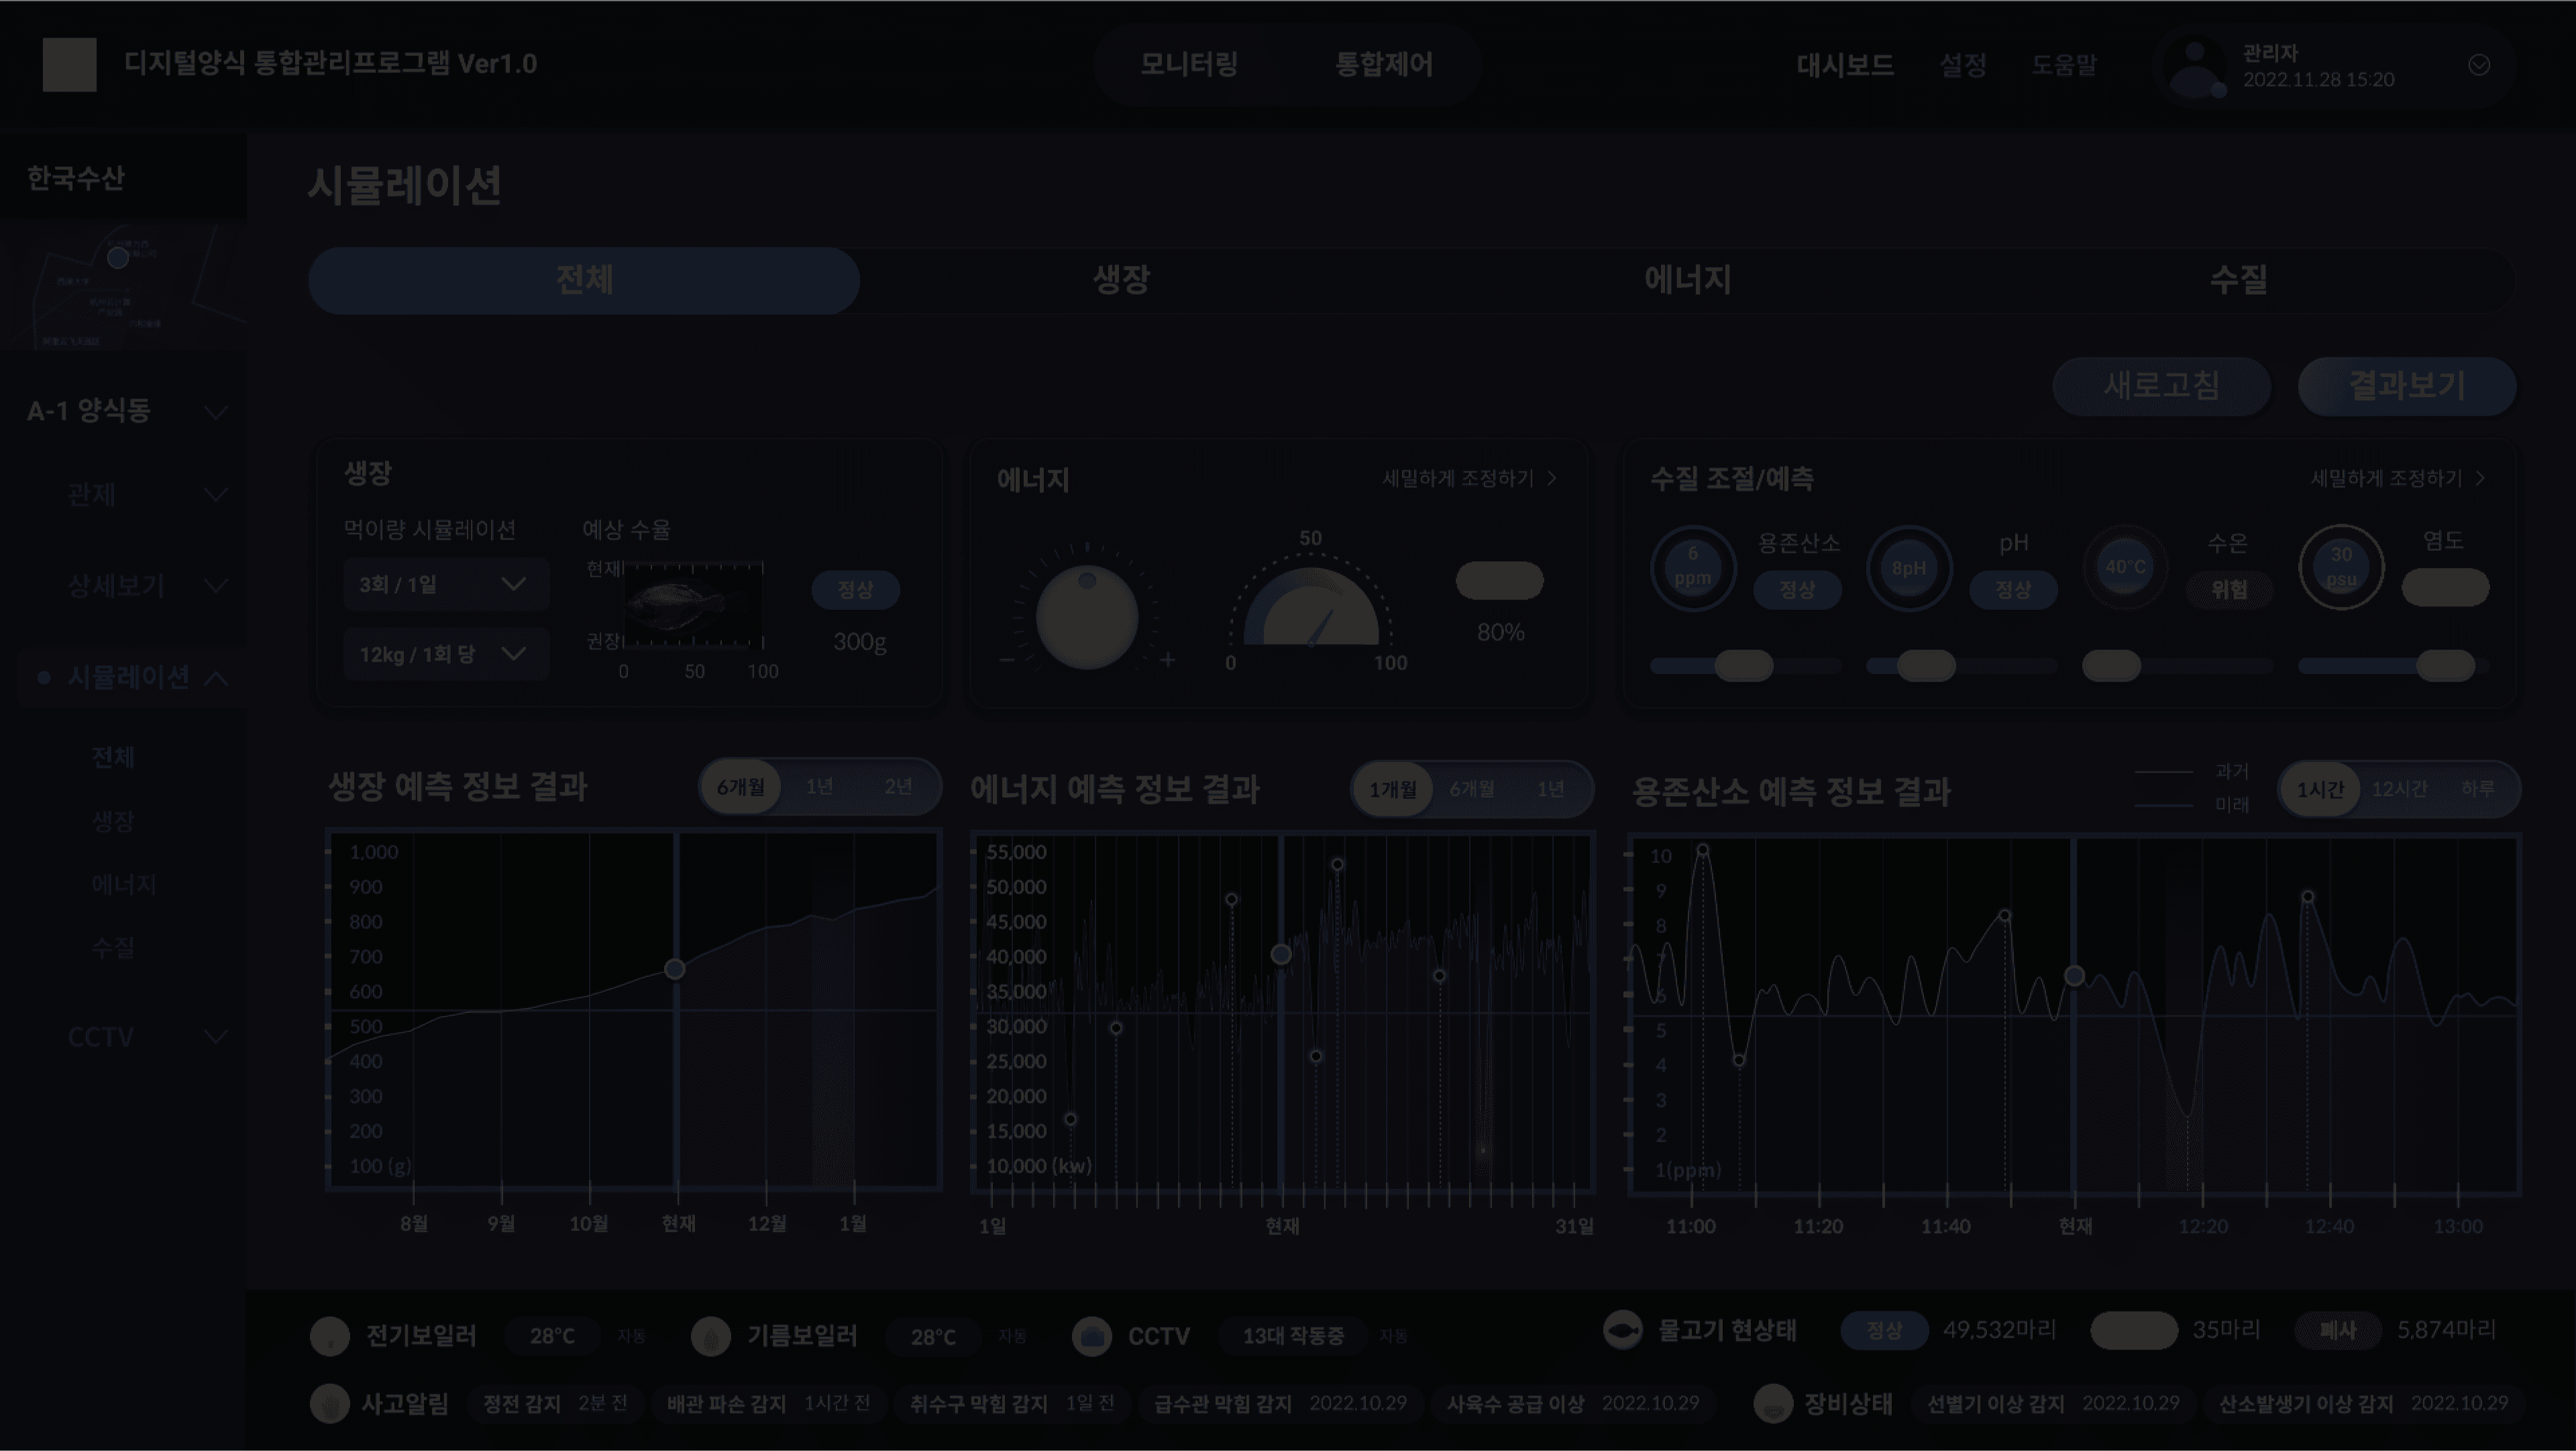
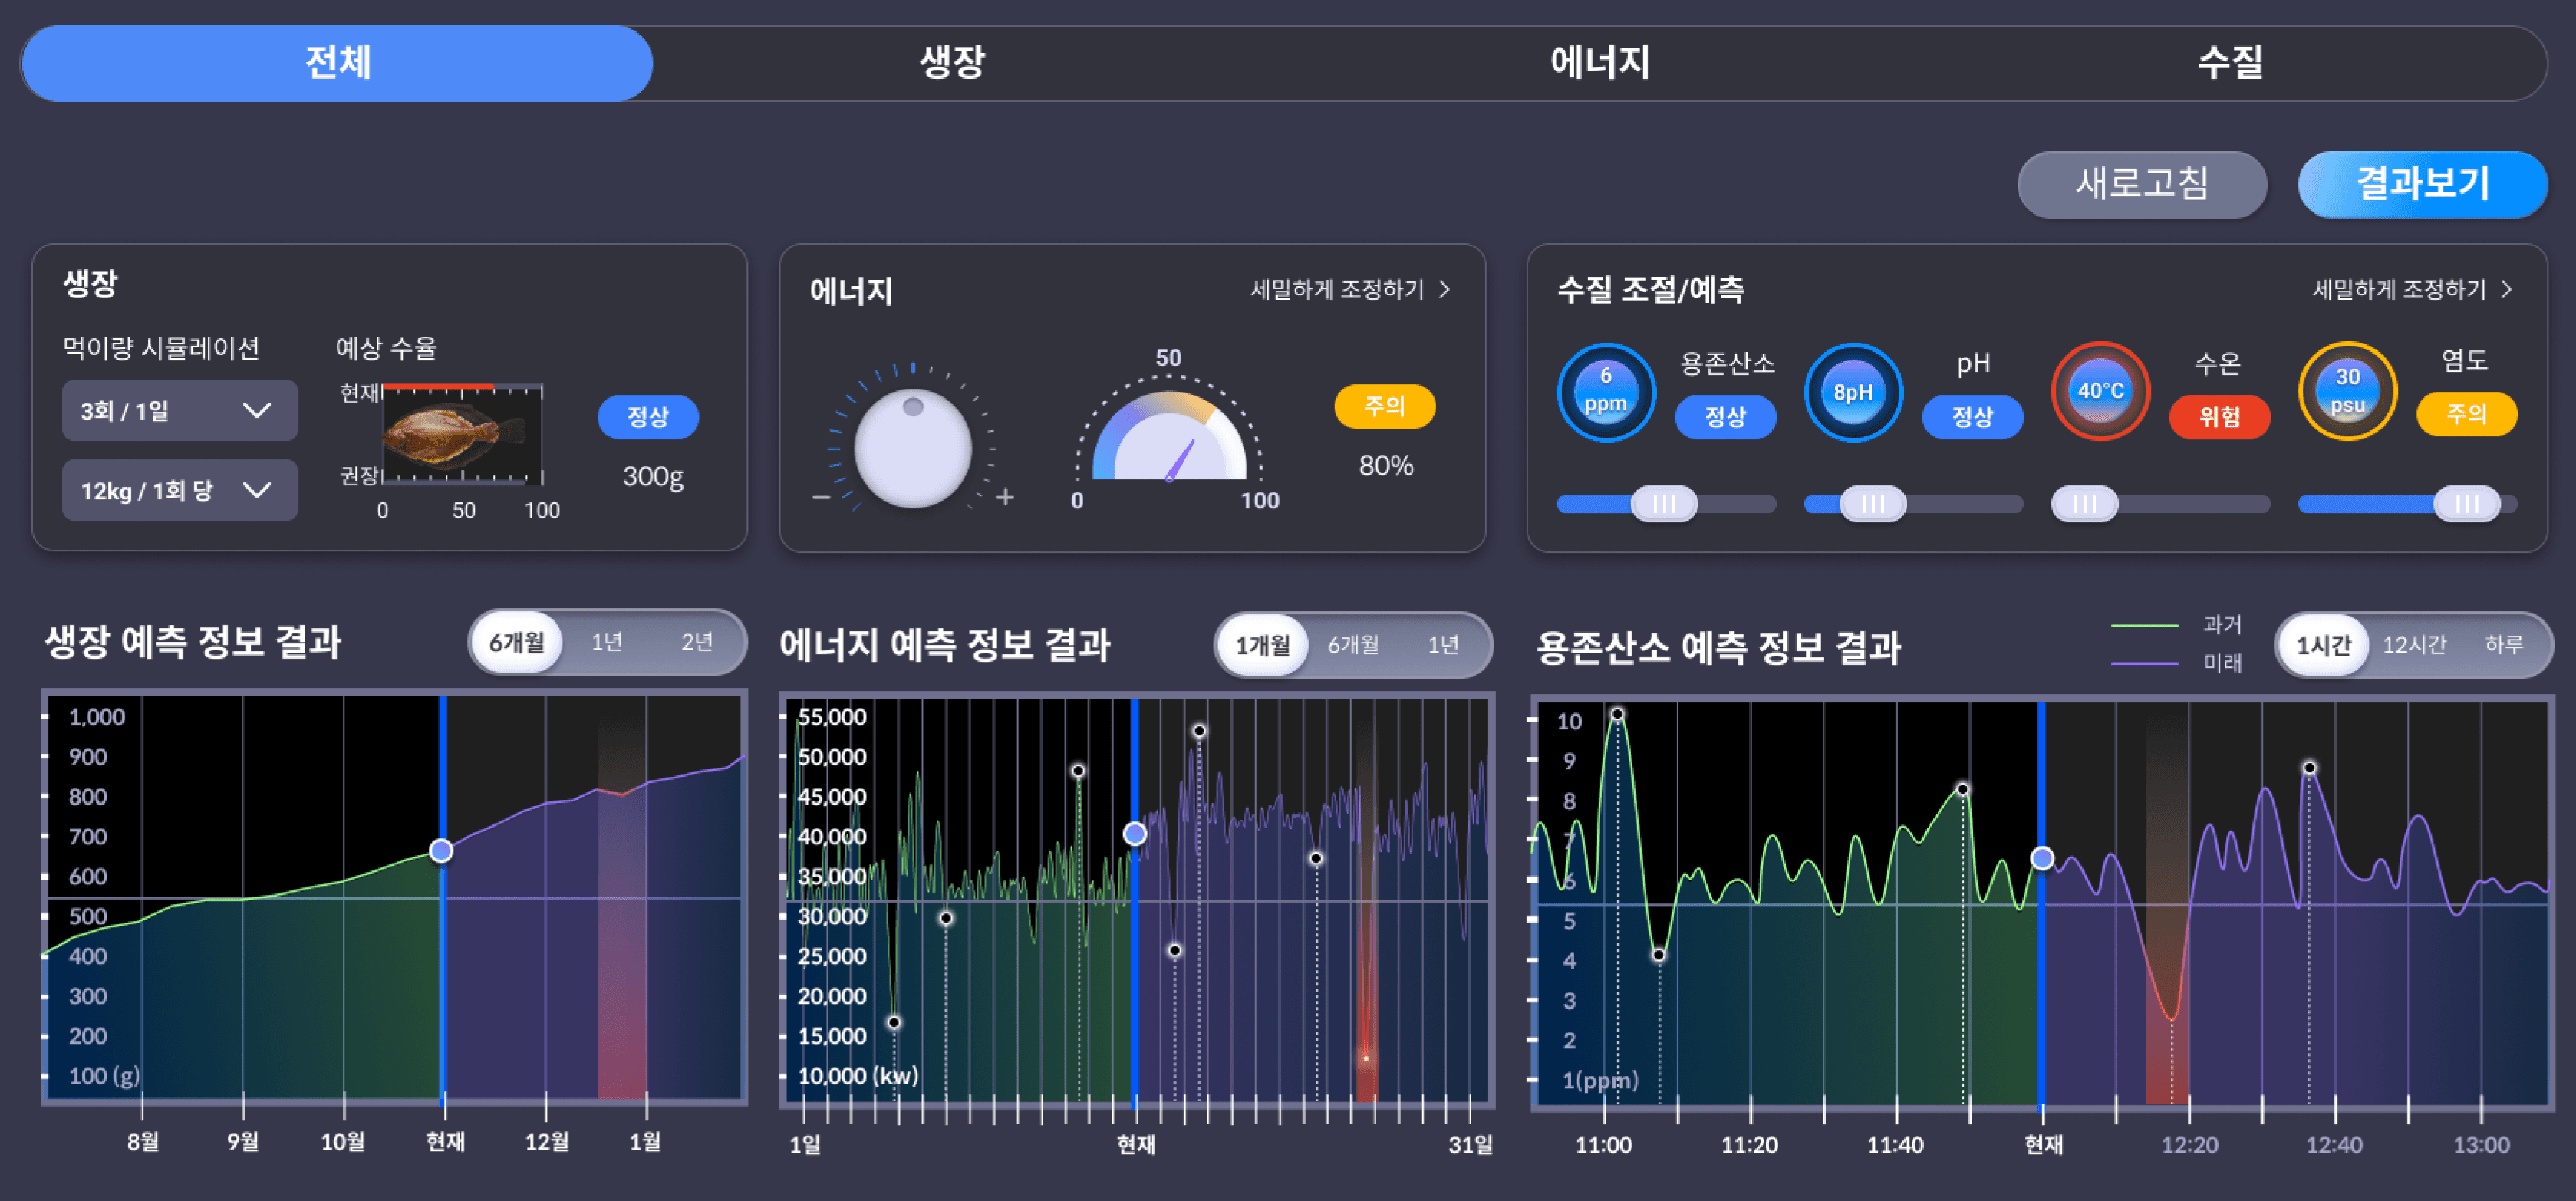
A preview of growth, energy, and water quality
simulations on one screen
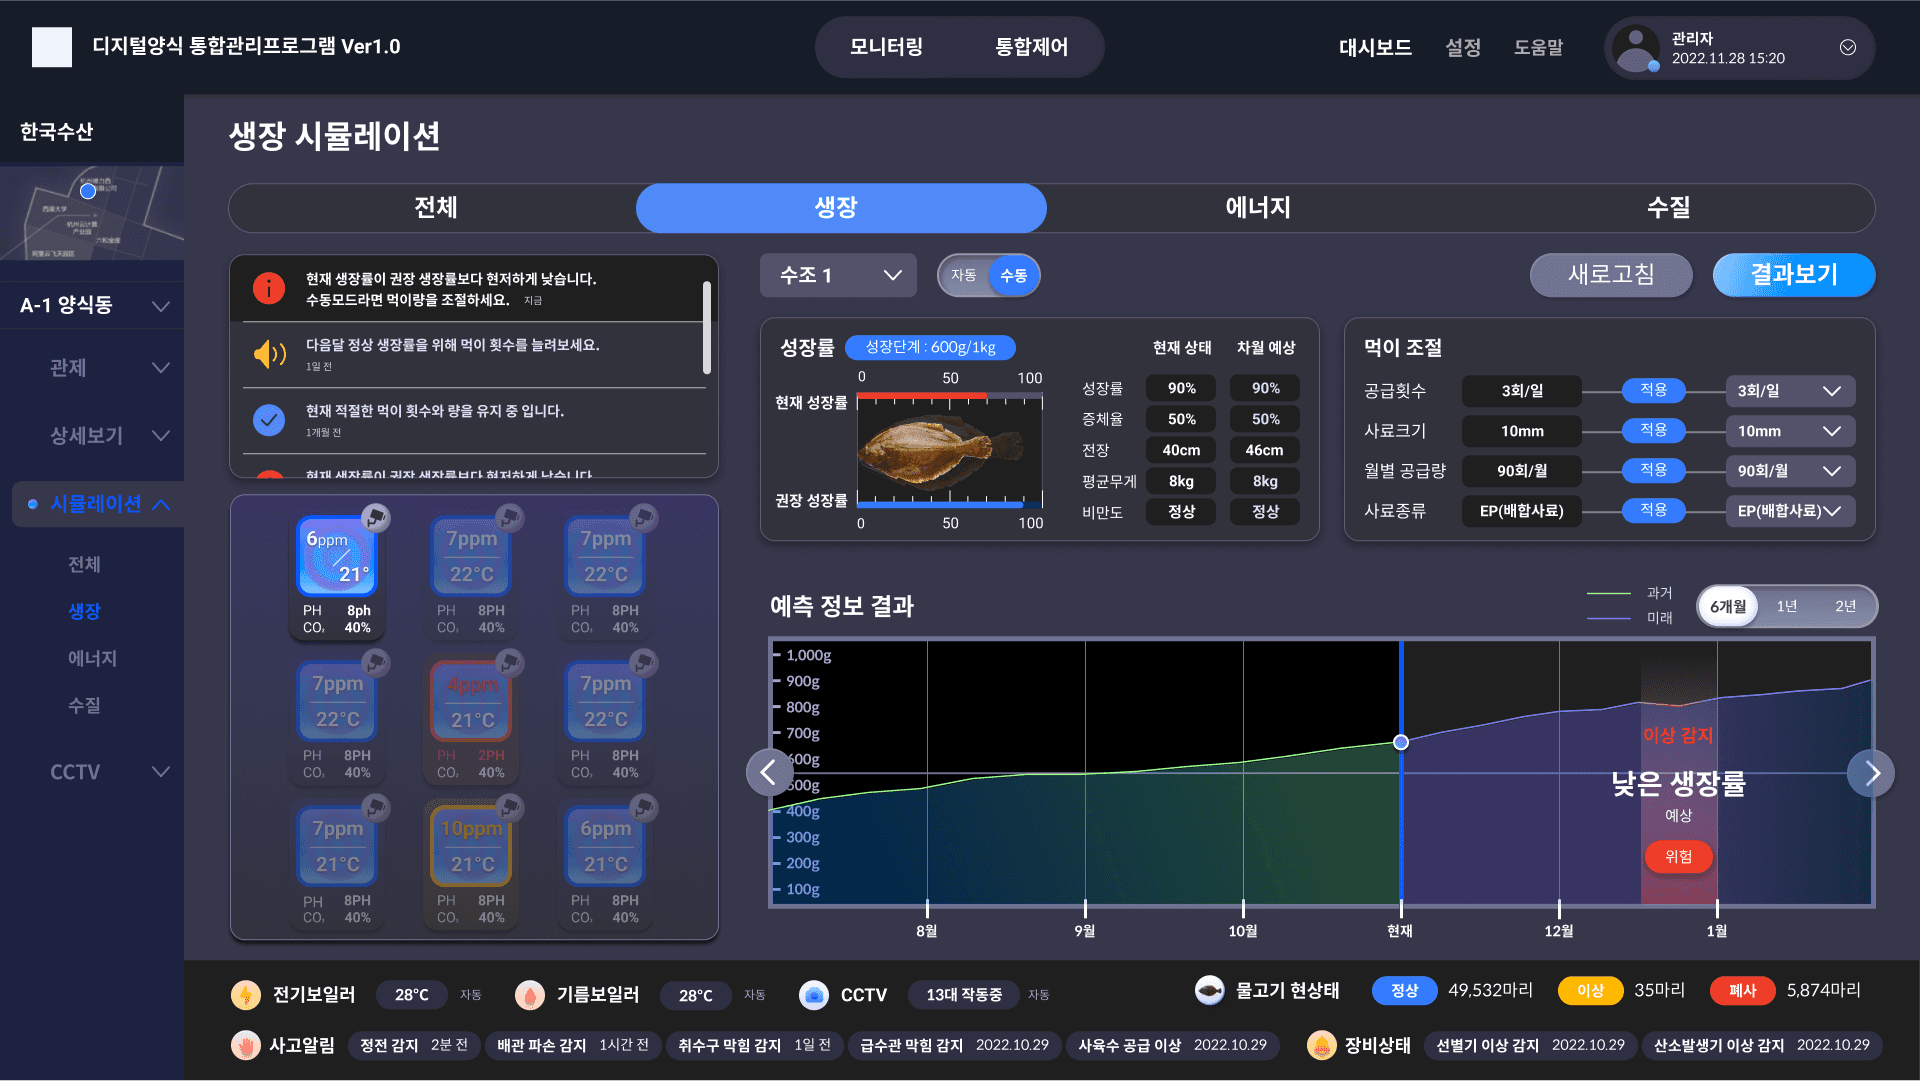
시뮬레이션 - 생장

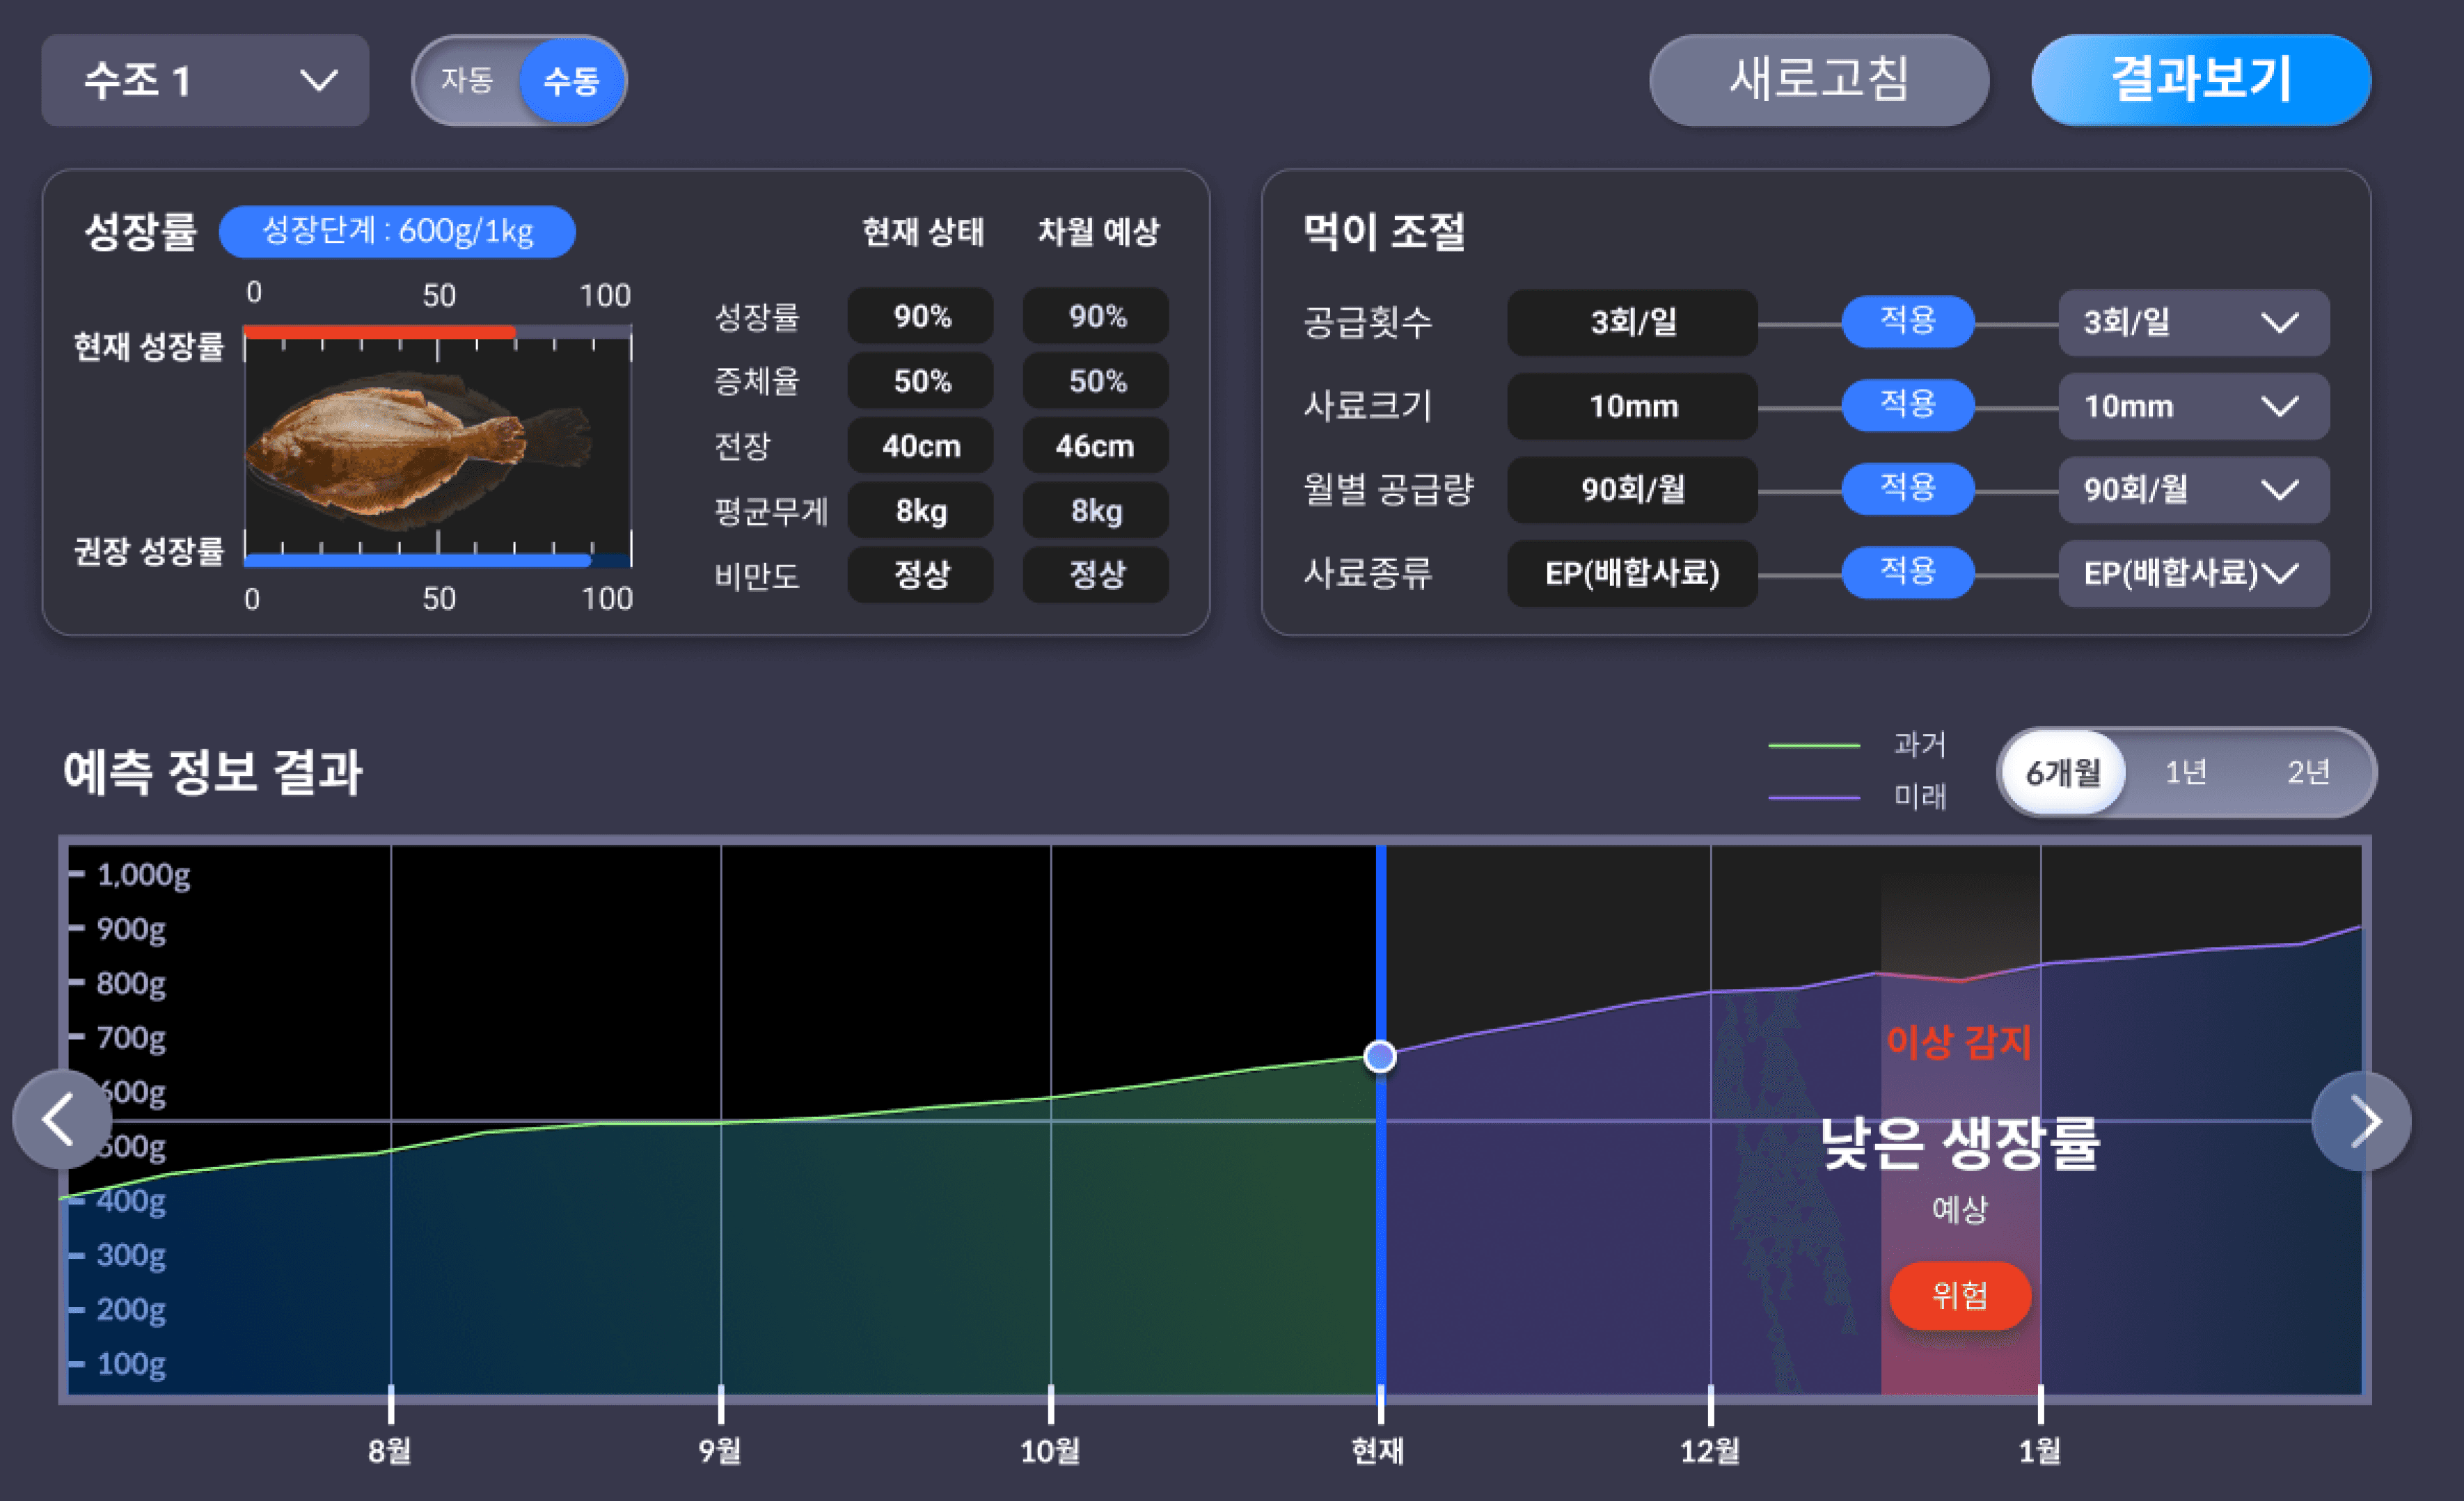
시뮬레이션을 확인하면서
실시간으로 수조 확인
먹이 조절을 통해 물고기의
성장률을 디테일하게 예측
시뮬레이션 - 에너지
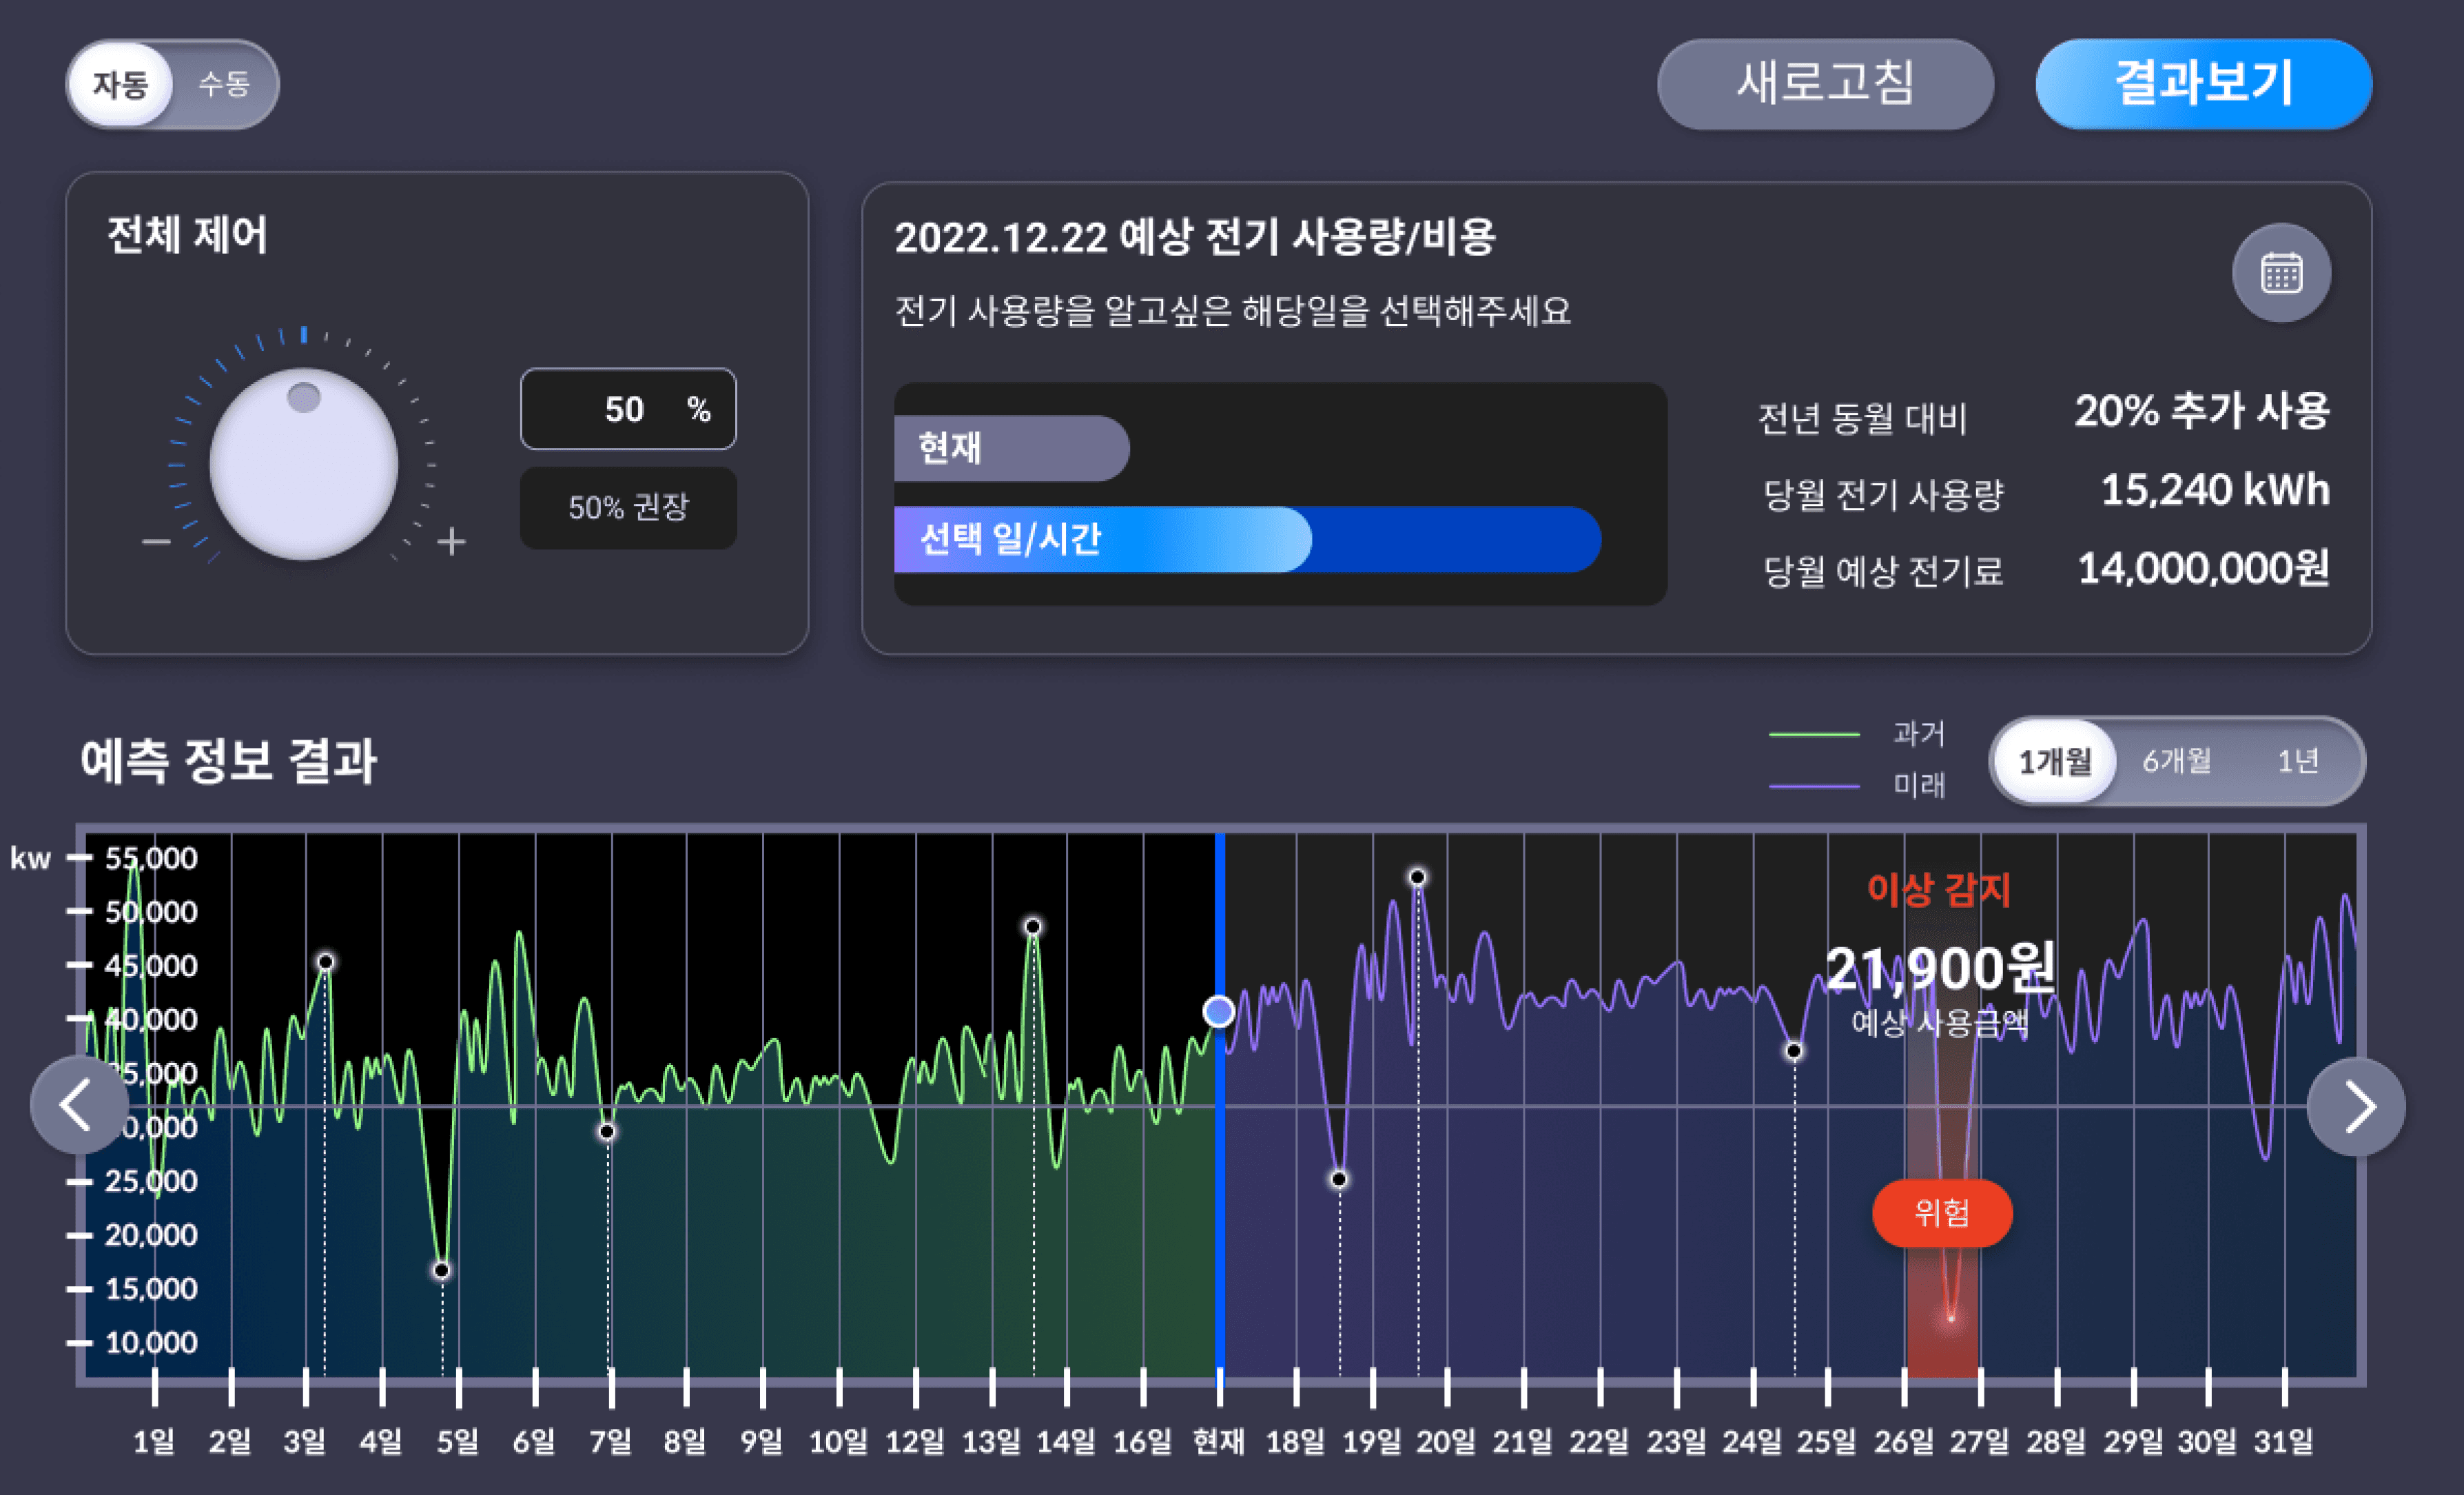
직관적인 전체 제어 버튼을 통해
과거 현재 미래의 에너지양을 모니터링 및 시뮬레이션
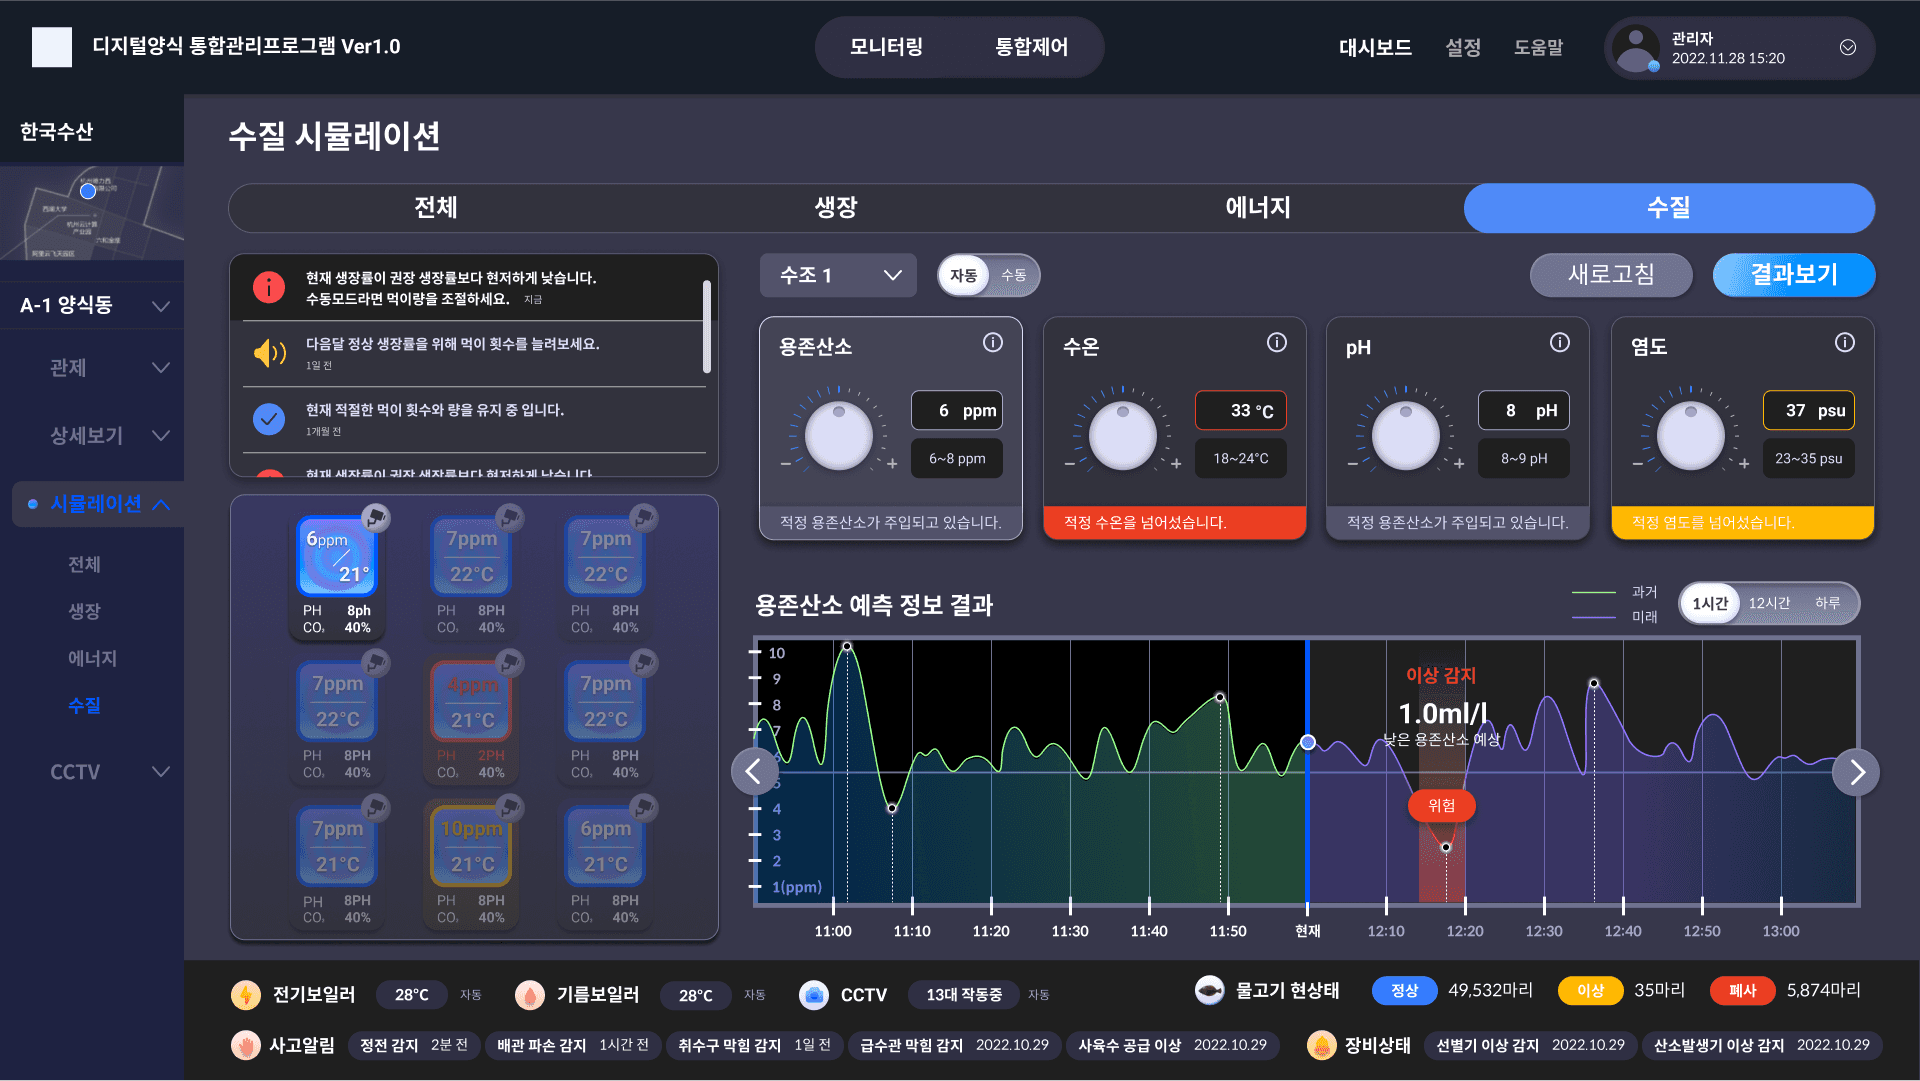
시뮬레이션 - 수질

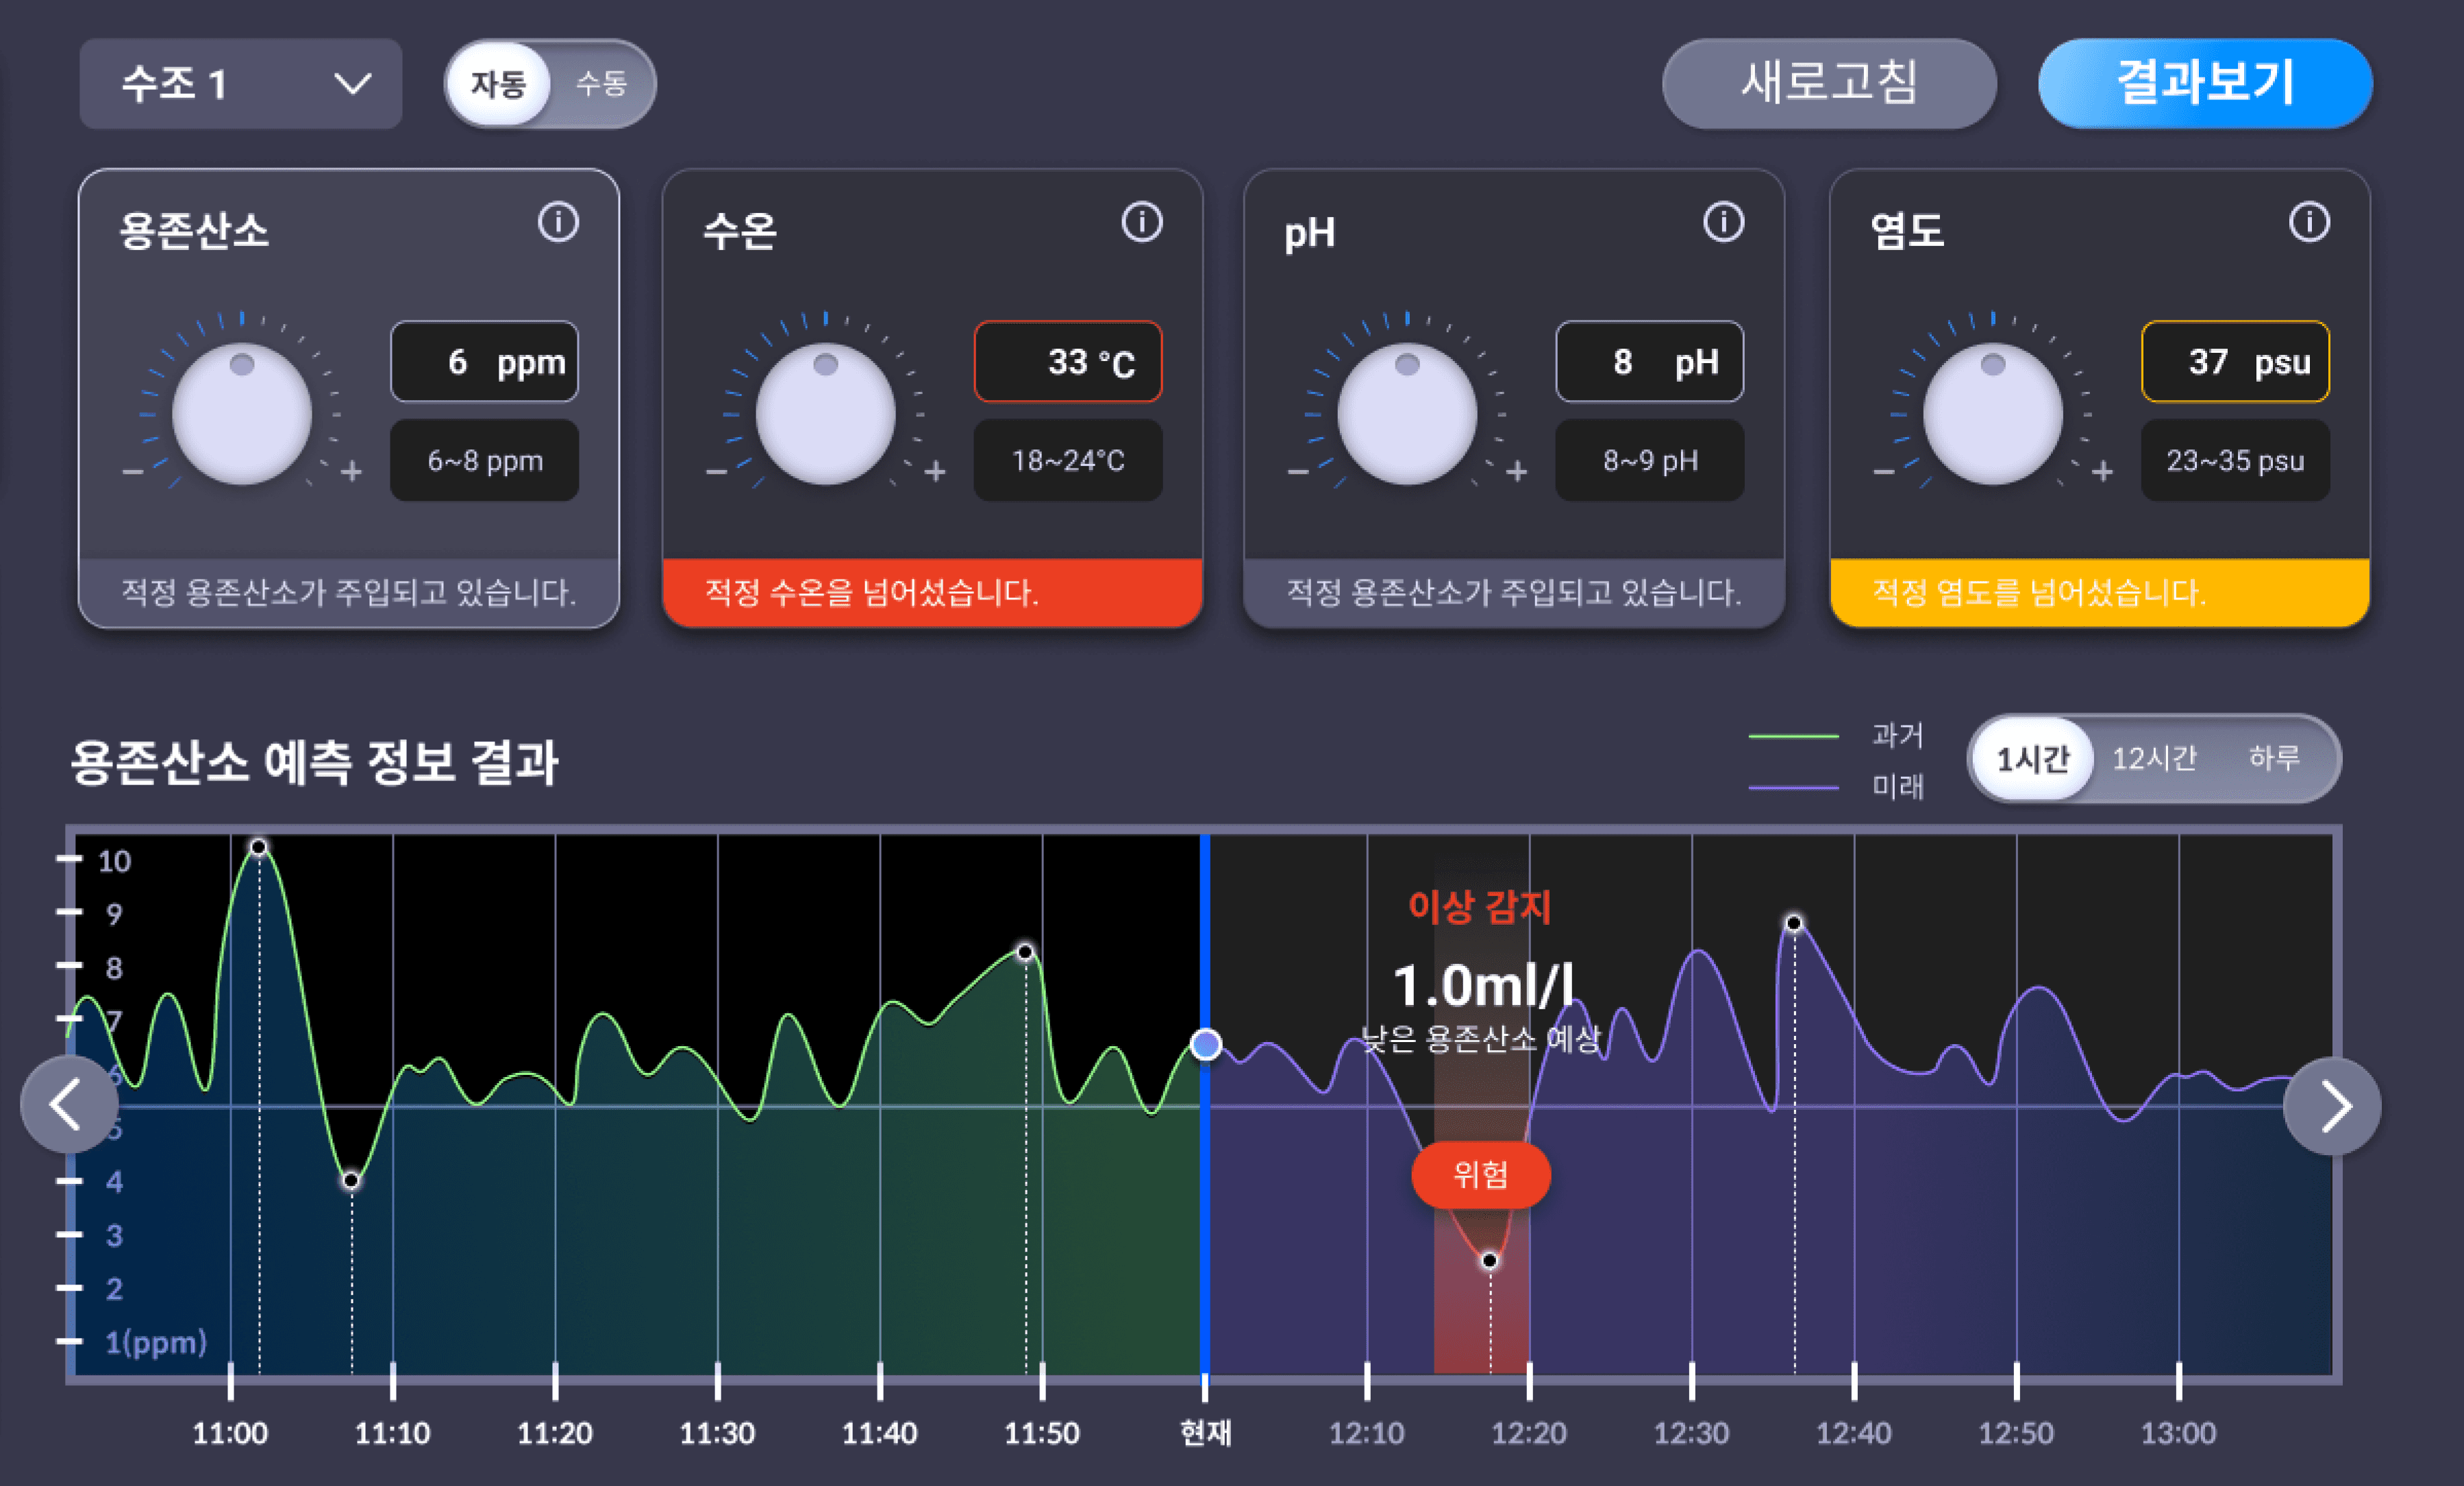
수질을 결정하는 4가지 요소 용존산소, 수온, pH, 염도를
다양하게 조절해보고 모니터링과 시뮬레이션
CCTV
CCTV
Check the actual condition
of the entire tank on screen
Check the actual
condition of the
entire tank on screen
Check the actual
condition of the entire
tank on screen
We designed the simulation feature, a core function of the Digital Twin Smart Aquaculture, to be easily understood and applied by a wide range of users. Users can freely check predicted values by applying various variables.
We designed the simulation feature, a core function of the Digital Twin Smart Aquaculture, to be easily understood and applied by a wide range of users. Users can freely check predicted values by applying various variables.
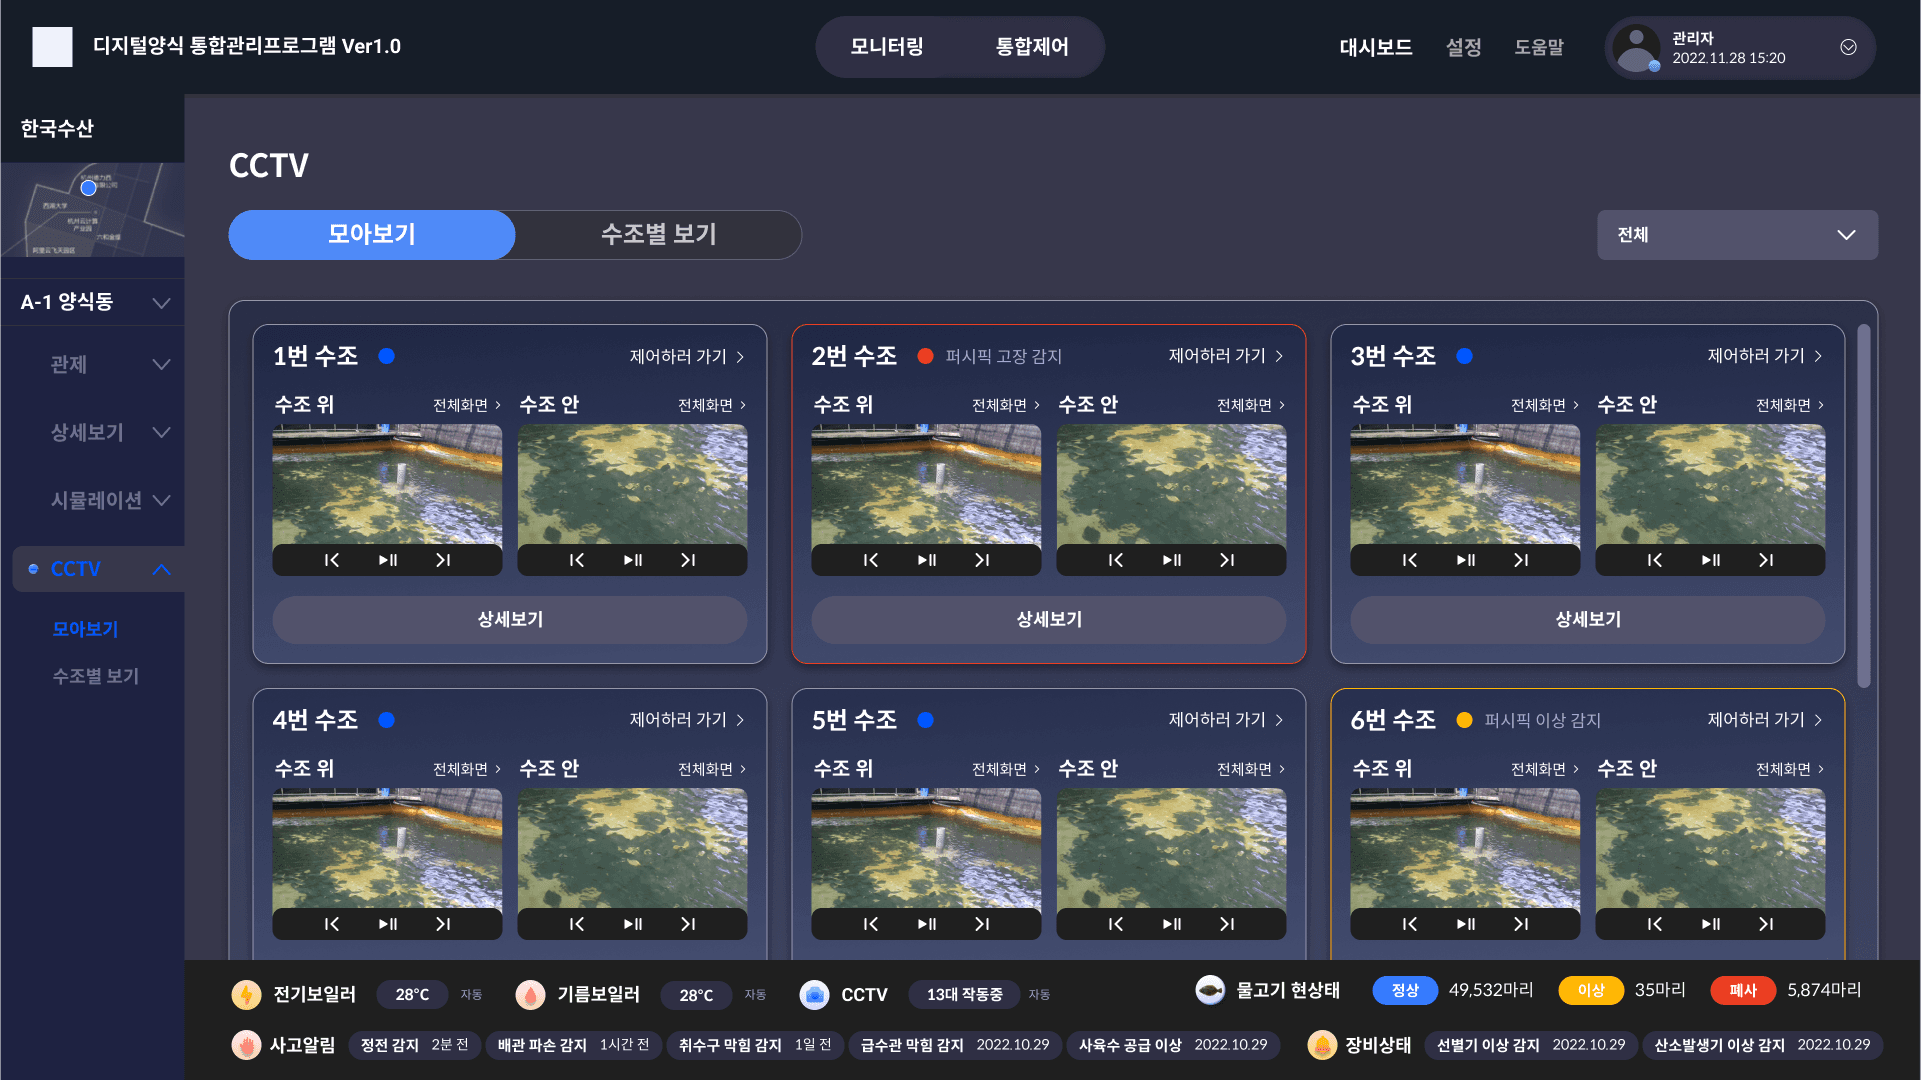
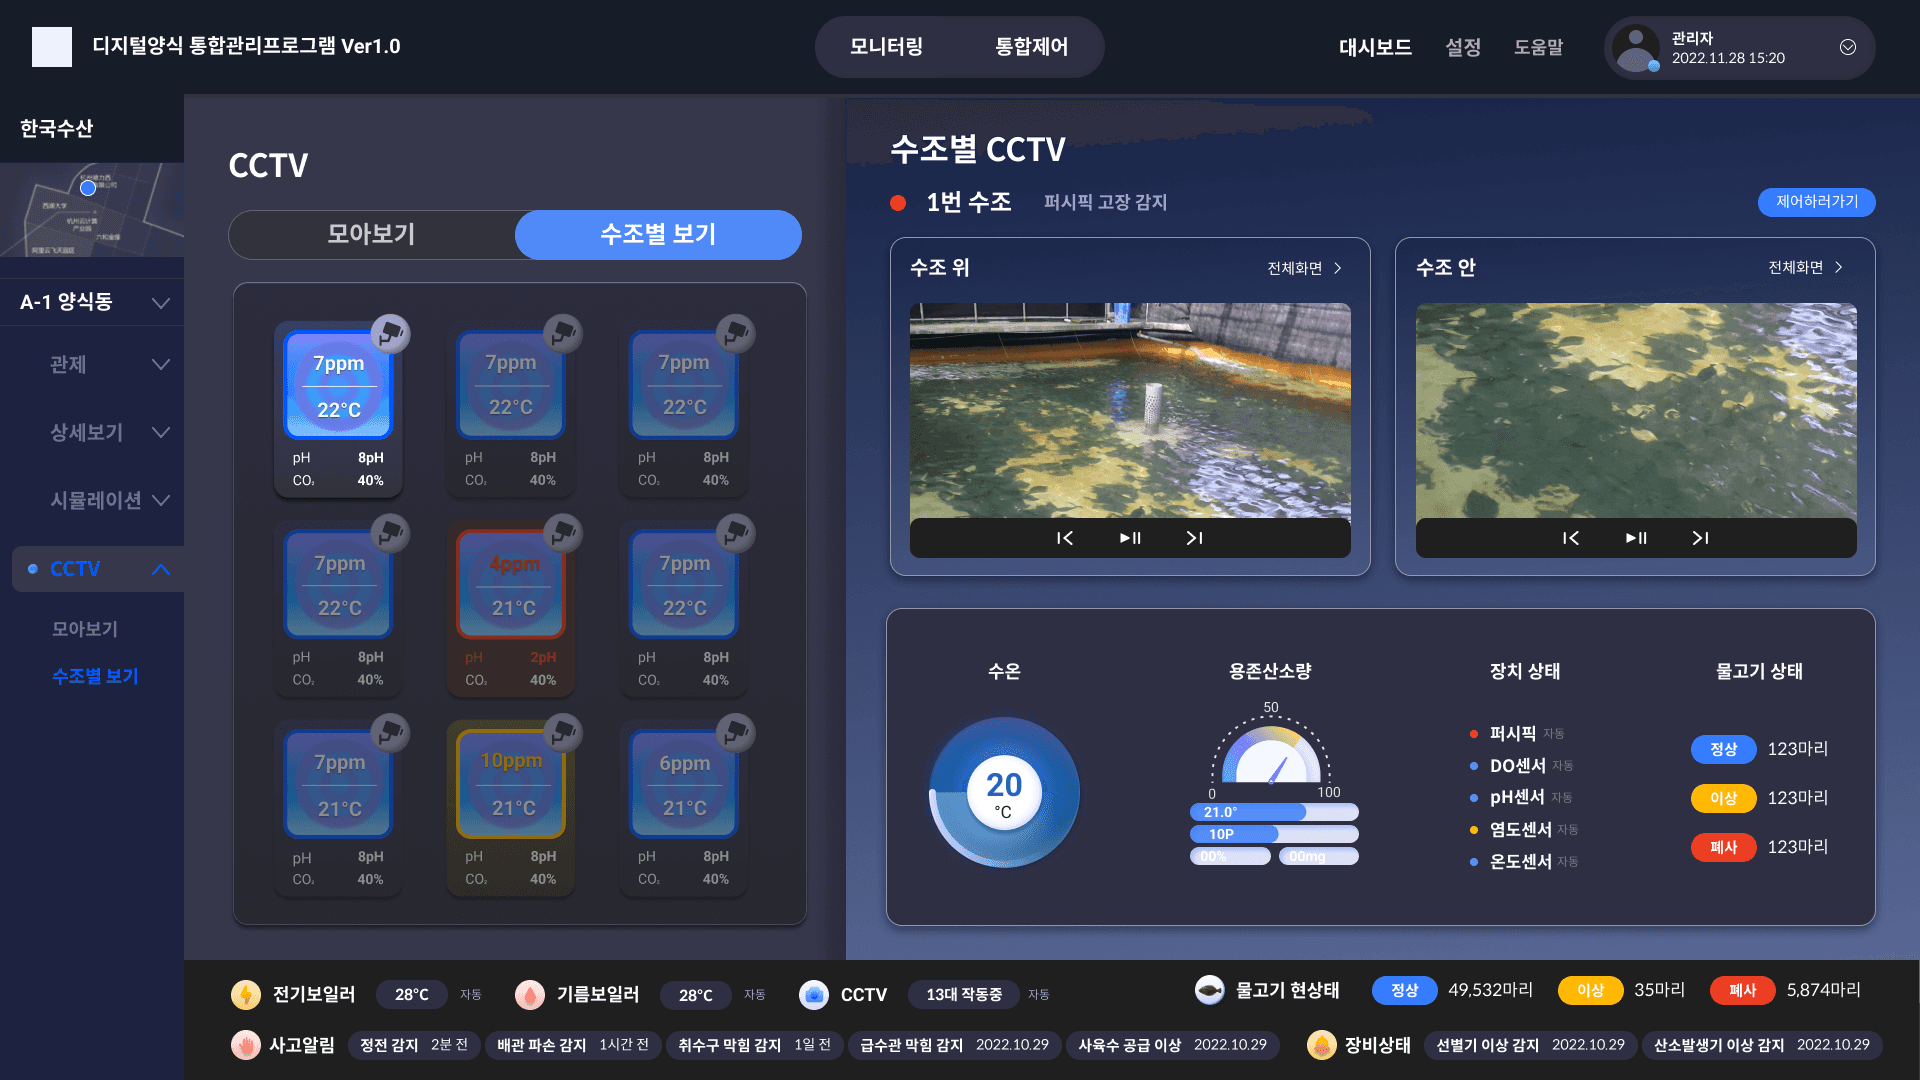
CCTV

You can check the actual appearance
and detailed status of each tank at once